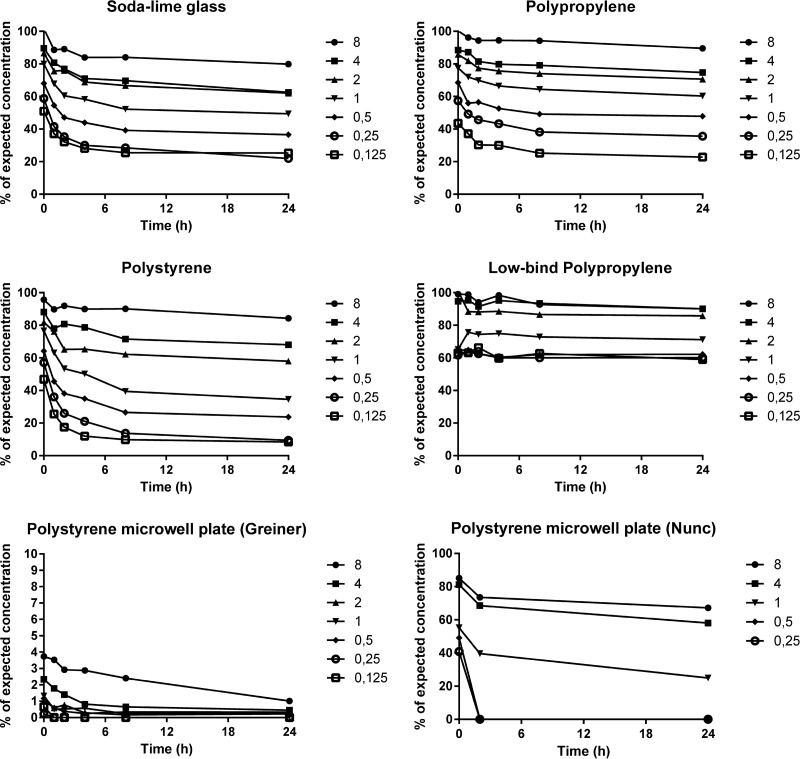
FIG 2.
Concentrations of colistin over time in the different materials as percentages of the expected concentrations (based on the measured concentrations in the stock solutions). Curves show means from triplicate experiments, except in microwell plates, where only one experiment was performed in the Nunc plates and two experiments in the Greiner plates (the second with sampling only at 0, 2, and 24 h) to verify the extremely low concentrations. Note the scale shift in the y axis for the Greiner plate. Target concentrations in milligrams per liter are indicated for the symbols.

