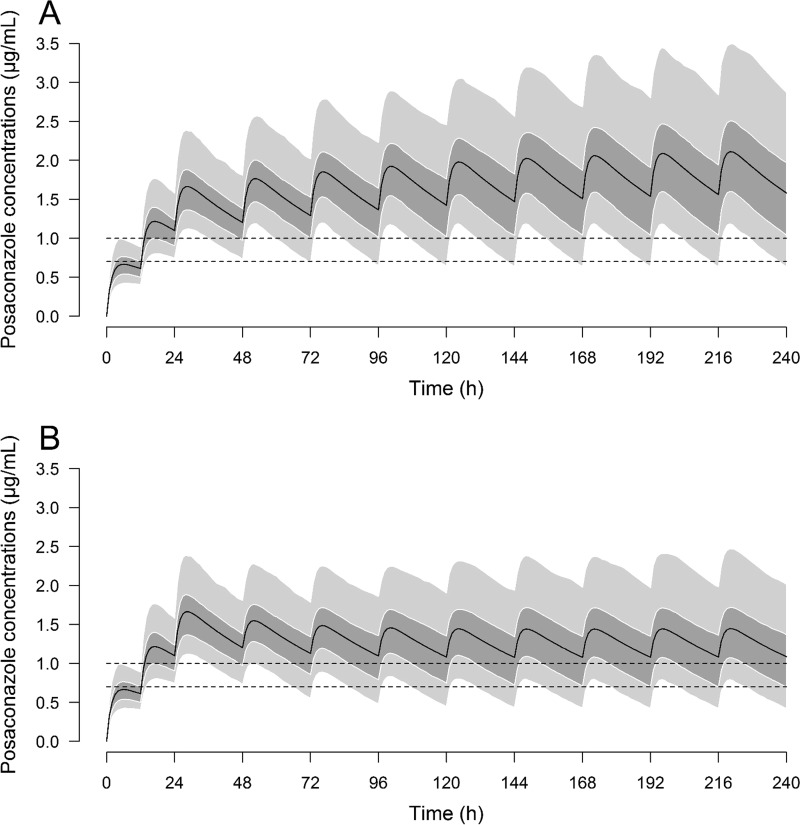
FIG 3.
Results of the Monte Carlo simulations. (A) Standard regimen (300 mg BID on day 1 and 300 mg thereafter); (B) lowered-dose regimen (300 mg BID on day 1, 300 mg QD on day 2, and 200 mg QD thereafter). Solid lines represent the mean concentration, the dark gray area is from the 25th to the 75th percentile, and the light gray areas are from the 5th to the 25th percentiles and from the 75th to the 95th percentiles. Dashed lines denote concentrations at 0.7 μg/ml and 1 μg/ml.

