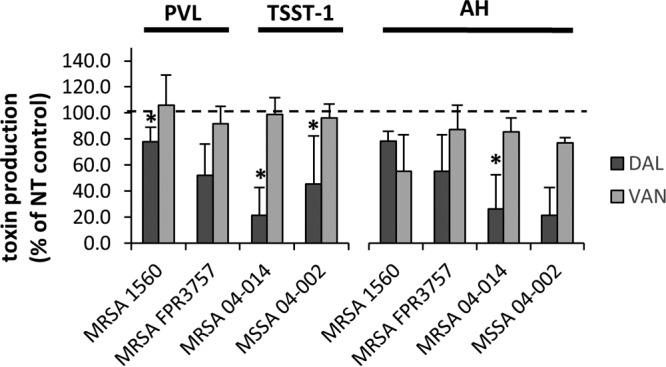
FIG 2.

Comparison of toxin protein production levels at 24 h following exposure to 1/4 the MIC of dalbavancin or vancomycin. S. aureus strains were cultured for 24 h in the presence of 1/4 the MIC of dalbavancin (DAL) or vancomycin (VAN). Bars represent the percentages of toxin production relative to the NT control, set at 100% (dashed line). Shown are PVL and TSST-1 levels (left) and AH levels (right) ± standard errors of three biological replicates. An asterisk (*) indicates that data are significantly different from those determined with the NT control (P ≤ 0.05) based on an ANOVA with false-discovery-rate adjustments.
