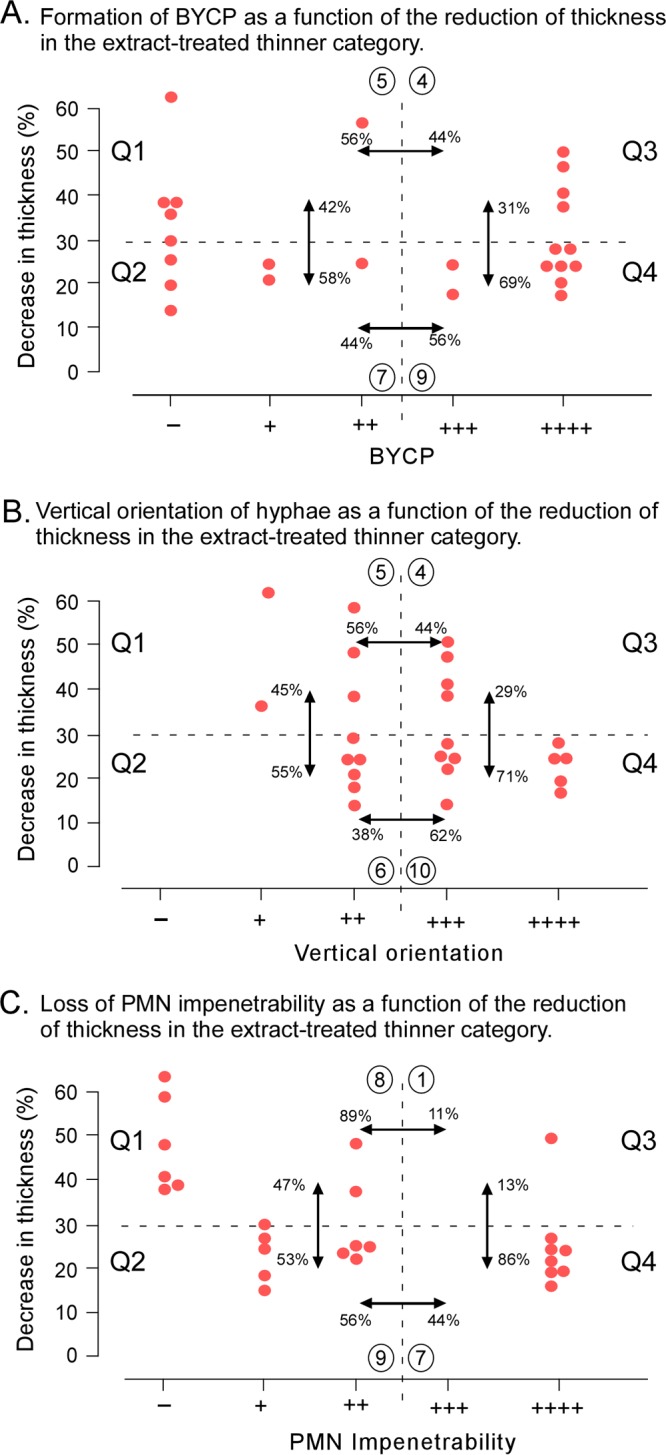
FIG 5.

Correlations between biofilm thickness and BYCP formation (A), vertical hypha orientation (B), and PMN impenetrability (C) among the 25 extract-treated biofilms that were significantly thinner than control biofilms. The three parameters are plotted as functions of the decrease in thickness. The plot is separated into four quadrants (Q1, Q2, Q3, and Q4) by dashed lines. The horizontal dashed line in each panel separates decreases of >30% from decreases of ≤30%. The vertical dashed line in each panel separates defective (a score of −, ++, or +++) from normal (a score of +++ or ++++) biofilms. Comparisons are noted by double-headed arrows between quadrants. The compared percentages were computed as the number of extract-treated biofilms in a quadrant (circled) divided by the total number in the two quadrants being compared multiplied by 100.
