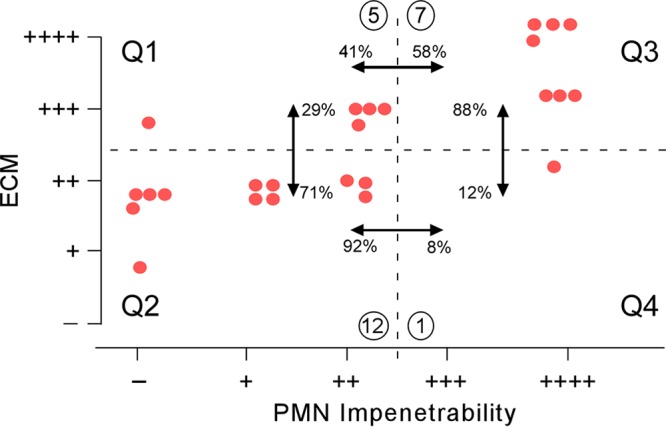
FIG 6.

Correlation between ECM staining and PMN impenetrability among the 25 extract-treated biofilms that were significantly thinner than control biofilms. Both the horizontal and vertical dashed lines demarcating the quadrants were based on separation of decreased (a score of −, +, or ++) versus normal (a score of +++ or ++++) assessments. Comparisons of quadrants are noted by double-headed arrows. The compared percentages were computed as the number of extract-treated biofilms in a quadrant (circled) divided by the total number in the two quadrants being compared multiplied by 100.
