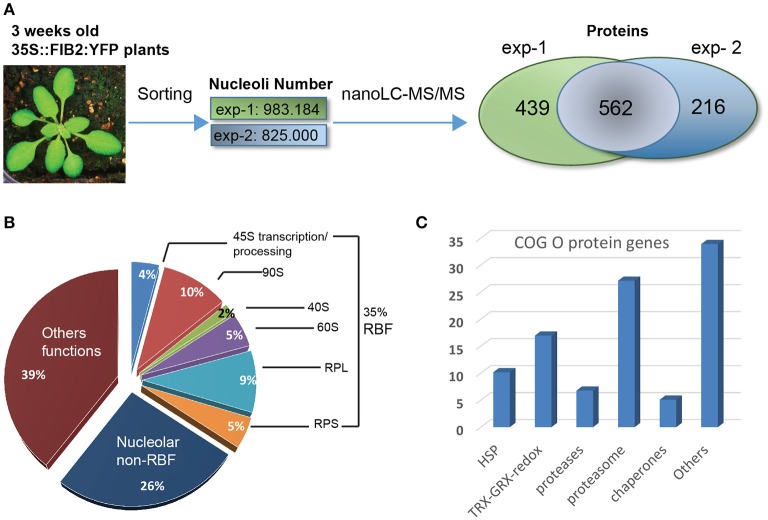
Figure 1.
Proteomic analysis of A. thaliana nucleoli. (A) Nucleoli extraction and nanoLC-MS/MS analysis from biological uplicates: exp-1 and exp-2. From left to right: picture of a 3 week-old leaves from WT FIB2:YFP A. thaliana, number of sorted nucleoli per experiment and Venn Diagram showing the number of proteins identified in exp-1 (1,001), exp-2 (778), and both (562). (B) Pie graph shows categories of proteins found in the nucleolar fractions. Proteins are classed in three major categories: Ribosome Biogenesis Factors or RBF (35%), nucleolar non-RBF (26%) and others functions (39%). RBF are detailed in sub-categories: 45S transcription/processing (4%), 90S processome (10%), 40S (2%) and 60S (5%) assembly factors, large (9%) and small (5%) ribosome sub-units (RPL and RPS). (C) The histogram shows the percentage of nucleolar proteins found in the Cluster of Orthologous Group (COG) O.

