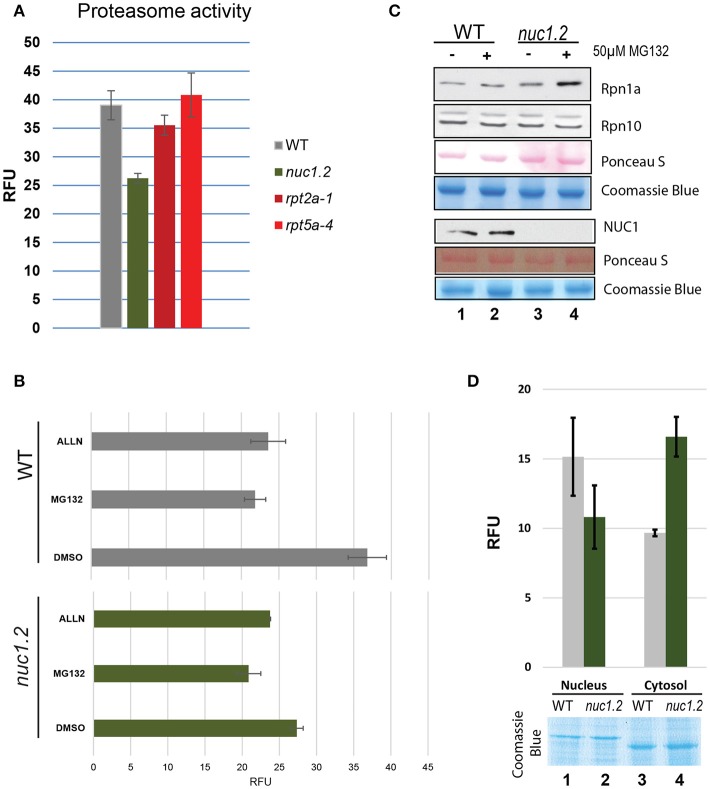
Figure 3.
Proteasome 26S activity in plant protein extracts. (A) The bar graph shows the proteasome activity in WT (gray), nuc1.2 (green), rpt2-1 (dark red) and rpt5-4 (red) plant protein extracts. The 20S proteasome activity is shown in Relative Fluorescence Units (RFU). (B) Histogram of proteasome activity in WT (gray) and nuc1.2 (green) protein extracts from plants treated with proteasome inhibitors MG132 or ALLN. Reactions without proteasome inhibitors (DMSO only) were used as control. (C) Western blot analysis to determine the protein level of Rpn1a and Rpn10 proteasome subunits in WT and nuc1.2 mutant plants. Gels and membranes were stained with Coomassie blue or S- Ponceau respectively to verify similar amount of protein in each sample. (D) Histogram of proteasome activity in nuclear and cytoplasmic fractions from WT (gray) and nuc1.2 (green) protein extracts. Gel was stained with Coomassie blue to verify similar amount of protein in each sample. Standard deviation of 3 independent experiments in (A,B) and (D) is indicated.

