
FIGURE 5.
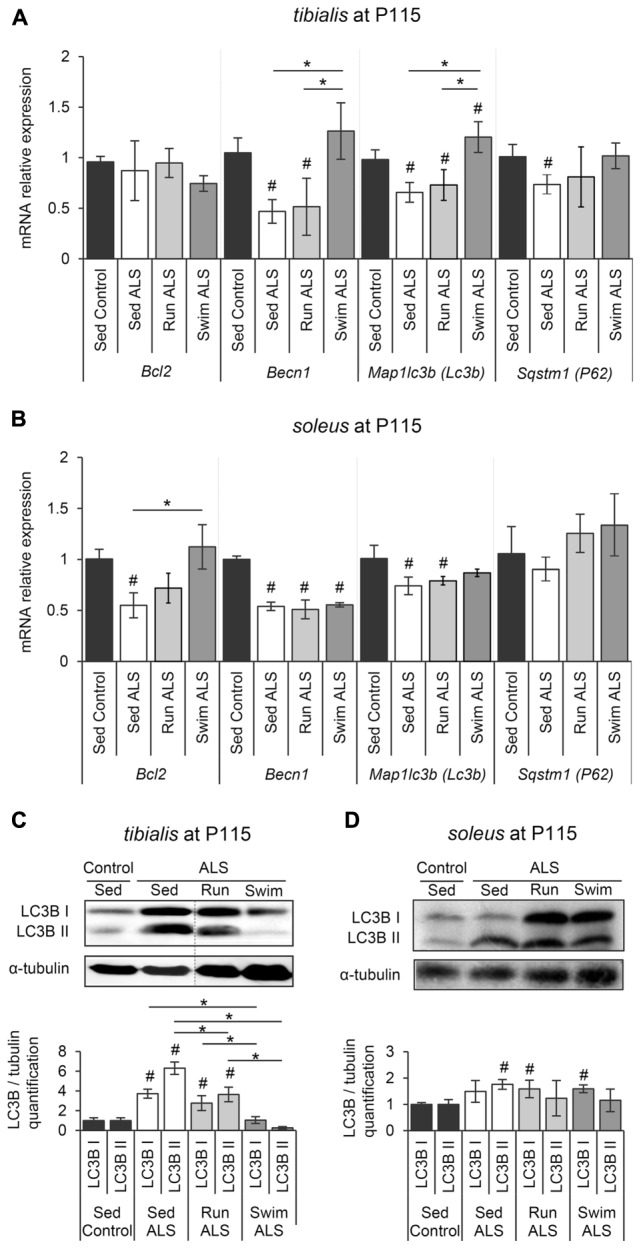
The swimming-based training restores the autophagic flux in ALS skeletal muscles. (A,B) Quantification by RT-qPCR of the expression of Bcl2, Becn1, Lc3b, and P62 mRNA levels in tibialis (A) and soleus (B) of Sed Control, Sed ALS, Run ALS, and Swim ALS mice at P115 (n = 5). mRNA expression levels were normalized with Rps26 mRNA. (C,D) Western blot analysis (upper panel) and quantification (lower panel) of LC3B I and LC3B II proteins in tibialis (C) and soleus (D) of Sed Control, Sed ALS, Run ALS, and Swim ALS mice at P115 (n = 3). Dotted lines on Western blot images symbolize some removed interspacing lanes for a side-by-side display of samples from all groups. All data are shown as mean ± SD. # and ∗ indicate significance (with P < 0.05) relative to the control and between ALS conditions, respectively.