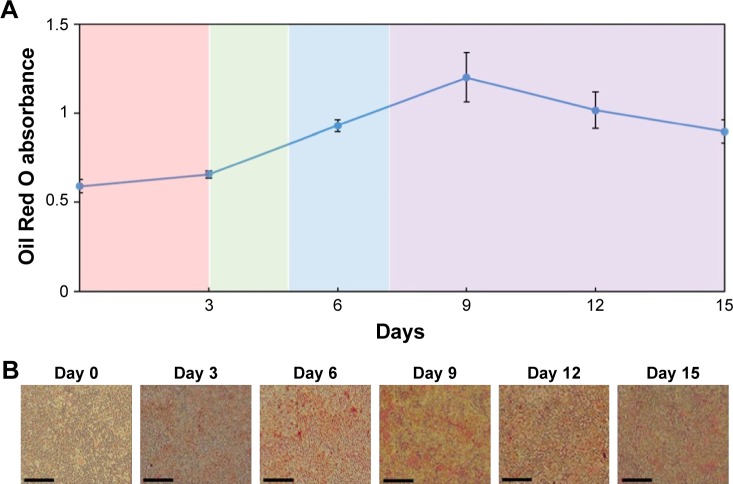
Figure 3.
Differentiation of 3T3-L1 cells to adipocytes.
Notes: (A) Quantification of lipid storage in cells was measured by the optical density of Oil Red O dye, which was extracted from treated cells. The bars represent the mean ± standard deviation (n=3). (B) Photographs of Oil Red O dye-stained cells at different periods. Bars =200 µm.

