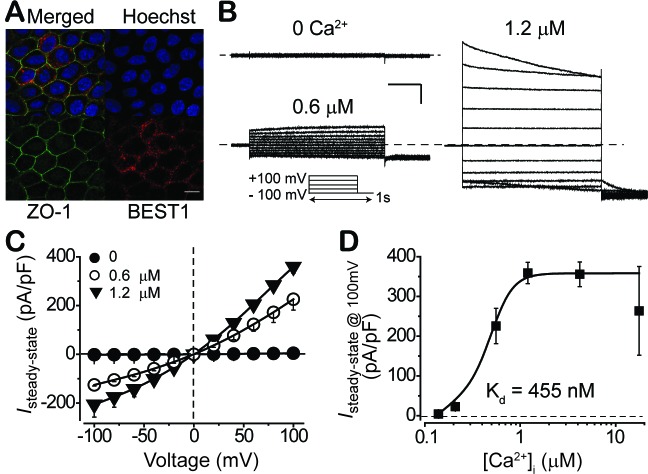
Figure 1. Subcellular localization of BEST1 and surface Ca2+-dependent Cl- current in BEST1 WT donor iPSC-RPEs.
(A) Confocal images showing plasma membrane localization of BEST1. Scale bar, 10 μm. (B) Representative current traces recorded from a BEST1 WT donor iPSC-RPEs at various free [Ca2+]i. Voltage protocol used to elicit currents is shown in Insert. Scale bar, 1 nA, 150 ms. (C) Population steady-state current-voltage relationships at different free [Ca2+]i; n = 5–6 for each point. The plot was fitted to the Hill equation. (D) Ca2+-dependent activation of surface current. Steady-state current density recorded at +100 mV plotted vs. free [Ca2+]i; n = 5–6 for each point. See also Figure 1—figure supplements 1 and Figure 1—source data 1.
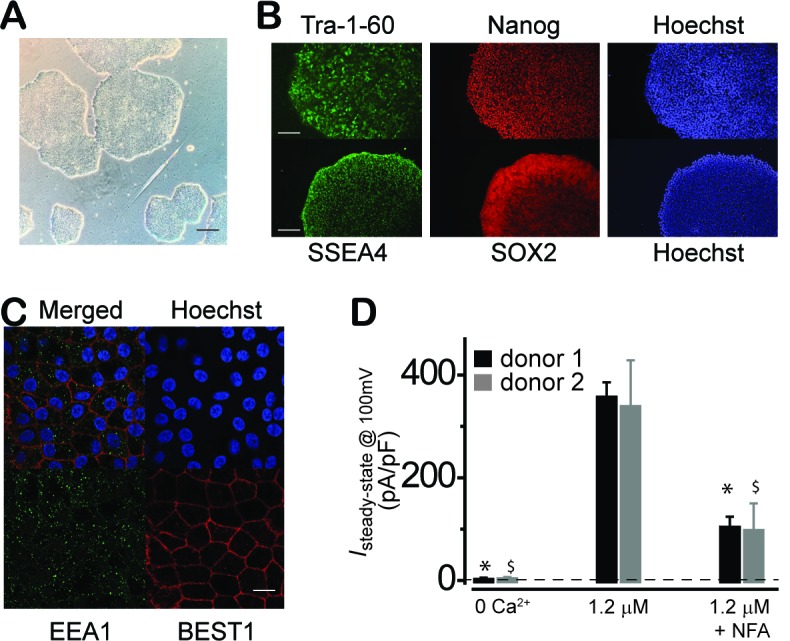
Figure 1—figure supplement 1. Characterization of WT iPSC and iPSC-RPE.


