Figure 4. Subcellular localization of BEST1 and surface Ca2+-dependent Cl- current in patient-derived iPSC-RPEs.
(A) Western blots show similar BEST1 expression levels in WT and patient-derived iPSC-RPEs. Each sample was from one cell lysis (BEST1 and β-actin, RPE65 and CRALBP were on two gels, respectively). (B) Confocal images showing diminished plasma membrane localizations of BEST1 P274R, and normal plasma membrane localization of BEST1 I201T. Scale bar,15 μm. (C) Representative current traces recorded from patient iPSC-RPEs at 1.2 μM [Ca2+]i. Scale bar, 500 pA, 150 ms. (D) Population steady-state current-voltage relationships in BEST1 WT (●), P274R (▲) and I201T (▼) iPSC-RPEs at 1.2 μM [Ca2+]i; n = 5–6 for each point. ∗p<0.05 (2 × 10⁻⁷ for P274R and 6 × 10⁻⁴ for I201T) compared to WT using two-tailed unpaired Student t test. Insert, confocal images showing P274R iPSC-RPE in bright field. Scale bar,10 μm. (E) CaCC currents in BEST1 P274R patient iPSC-RPE were rescued by complementation with WT BEST1-GFP. Complementation (▲, n = 5–6 for each point), compared to BEST1 P274R (▲, n = 3–5 for each point), and WT (●). The plots were fitted to the Hill equation. Insert, confocal images showing P274R iPSC-RPE complemented with WT BEST1-GFP expressed from a BacMam baculoviral vector. Scale bar,10 μm. (F) Ca2+-dependent currents in BEST1 I201T iPSC-RPE (▼) compared to WT iPSC-RPE (●). Steady-state current density recorded at +100 mV plotted vs. free [Ca2+]i; n = 5–6 for each point. The plots were fitted to the Hill equation. See also Figure 4—figure supplement 1 and Figure 1—source data 1.

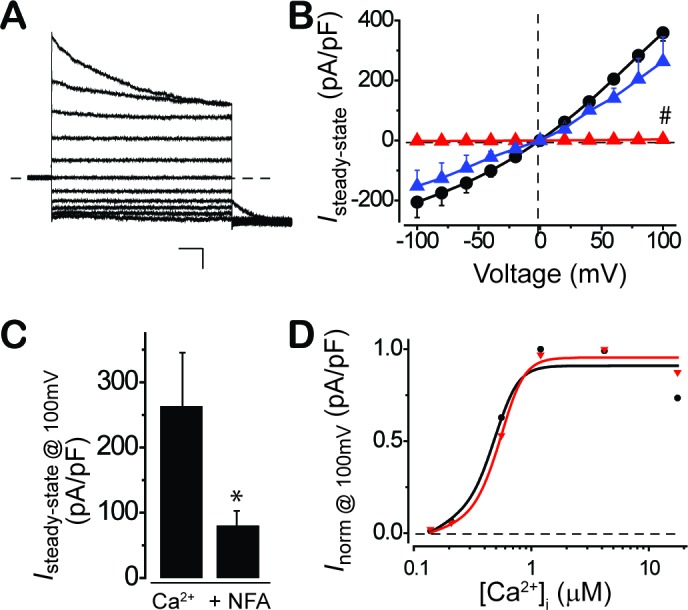
Figure 4—figure supplement 1. CaCC currents in BEST1 patient iPSC-RPEs.