. 2017 Oct 24;6:e29914. doi: 10.7554/eLife.29914

Figure 8. Superposition of KpBest WT with L177T mutant based on regional alignment of residues 174–180.

Ribbon diagram of the KpBest WT chain A (blue) and KpBest L177T chain A (green) with highlighted stick diagram of residue 177. See also Figure 8—figure supplement 1 and Figure 8—source data 1.
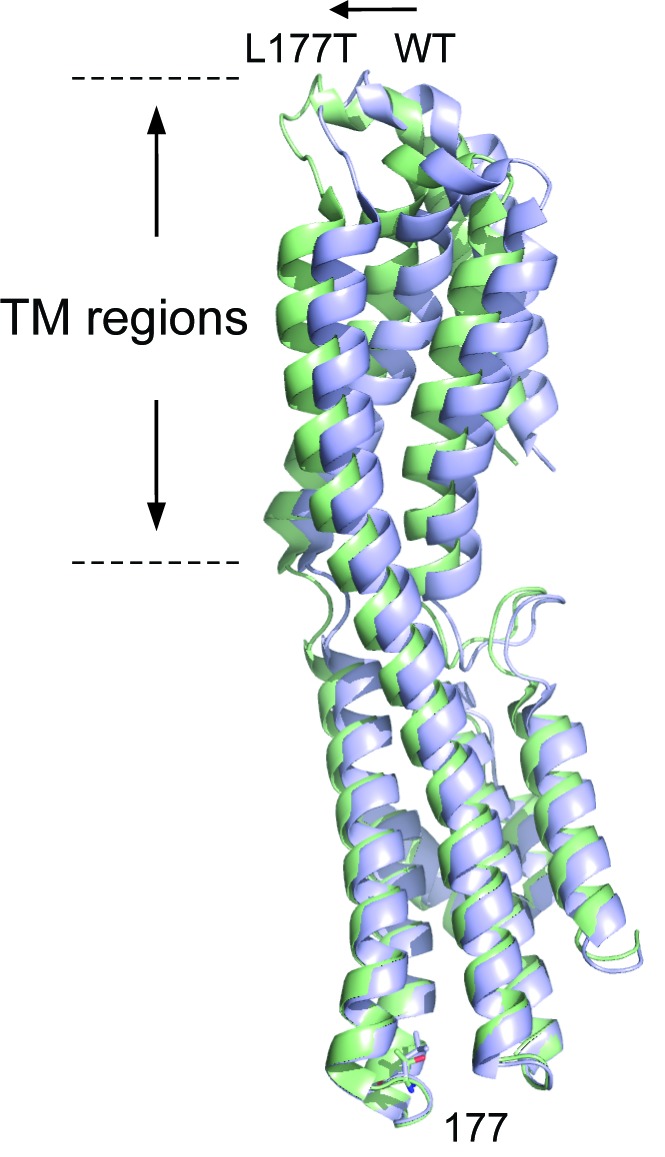
Figure 8—source data 1. Data collection and refinement statistics of KpBest L177T.
aStatistics for the highest-resolution shell are shown in parentheses.
DOI: 10.7554/eLife.29914.020

Figure 8.

Figure 8—figure supplement 1. Crystal structure of KpBest L177T.
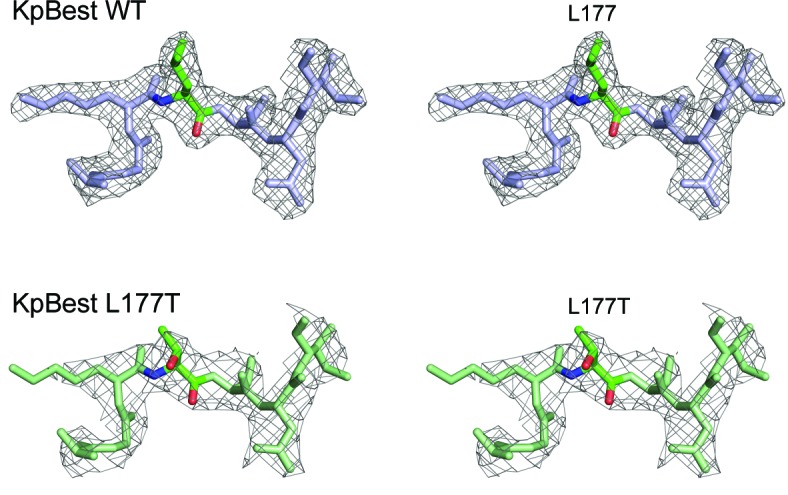
Figure 8—figure supplement 1.

Stereo images of the electron density maps (2Fo-Fc map, 1.2σ level) of KpBest WT (top, 2.3 Å) and L177T (bottom, 3.1 Å) presenting residues 174–180 for divergent ‘wall-eyed’ viewing.