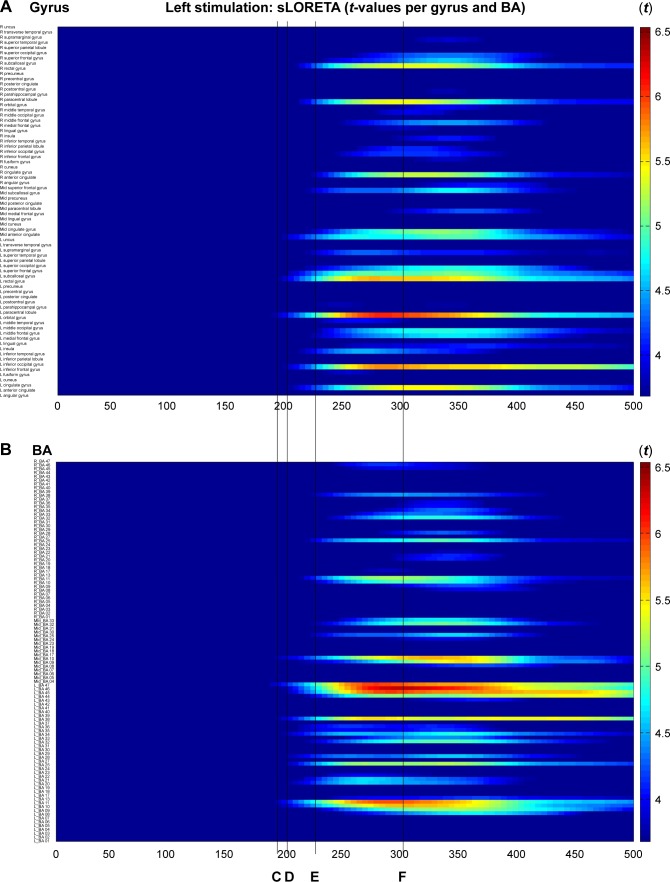
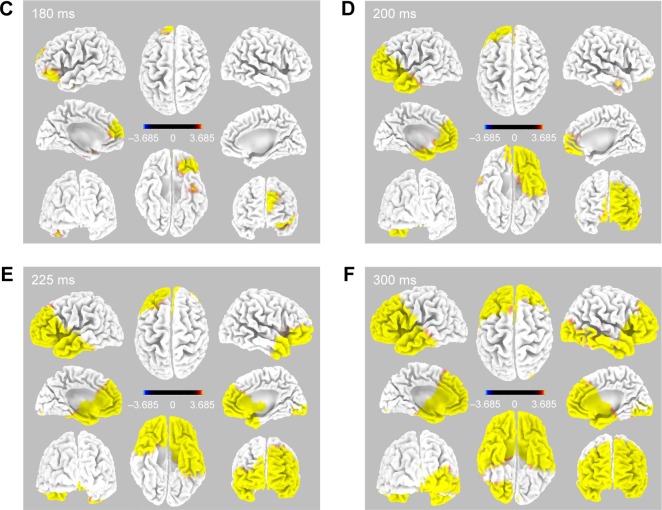
Figure 2.
Time-dependent spatiotemporal cortical activation pattern on left CM stimulation assessed by sLORETA.
Notes: Spatiotemporal source maps, showing the color coded t-values of individual gyrus (A) and BA (B) over the time course immediately after initiation of 5 Hz stimulation. The t-values >3.685 are significant at a level of p<0.05. 3D reconstructions at selected time points (C–F).
Abbreviations: 3D, three dimensional; BA, Brodmann area; CM, centromedian thalamic nucleus; L, left; R, right; sLORETA, standardized low-resolution brain electrotomography.


