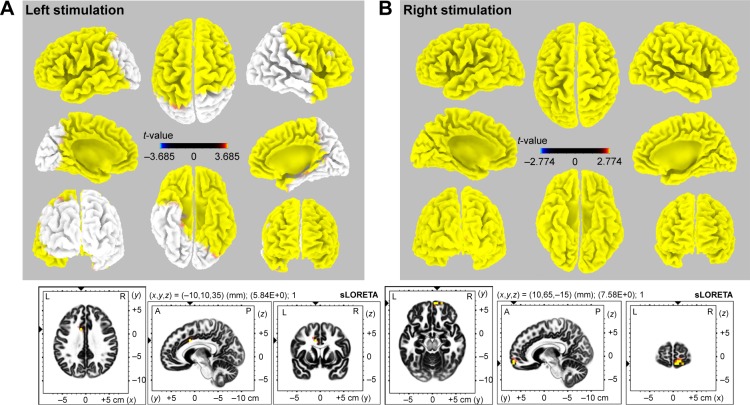
Figure 4.
3D map of sLORETA images demonstrates the statistically significant activated area with CR.
Notes: Left stimulation (A): bilateral frontal, left temporal, and right anterior temporal areas were activated (p<0.05, t-value 3.685). The maximal activation was observed at the left cingulate gyrus (t-value 5.84, p<0.01, MNI coordinate -10, 10, 35). Right stimulation (B): diffuse cortical areas were activated (p<0.05, t-value 2.774). The maximal activation was found at the right medial frontal gyrus (t-value 7.58, p<0.01, MNI coordinate 10, 65, -15).
Abbreviations: 3D, three dimensional; A, anterior; CR, cortical recruiting response; L, left; MNI, Montreal Neurological Institute; P, posterior; R, right; sLORETA, standardized low-resolution brain electrotomography.

