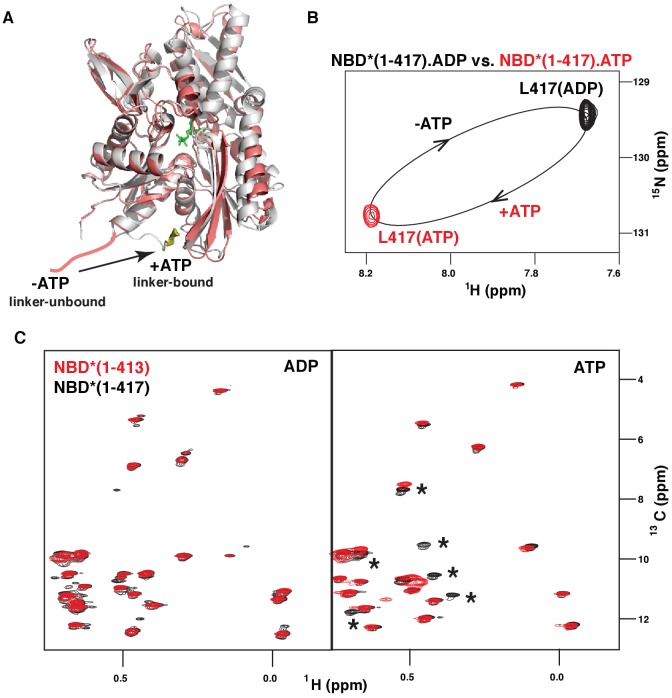
Figure 3. ATP-induced linker binding to the BiP NBD.
(A) Ribbon representation of the structures of two BiP NBD conformations: linker-bound and linker-unbound. The ATP-bound NBD structure (grey, linker bound; the linker is shown in yellow) is taken from the domain-docked structure of FL BiP (PDB 5e84 [Yang et al., 2015]); the ADP-bound structure (pink) is taken from the ADP-bound isolated BiP NBD (residues 1–407) PDB 5evz (Hughes et al., 2016); for ADP-bound conformation the linker region (after residue 407) is schematically shown in pink. (B) Blowup of the representative region of amide TROSY of the ADP-bound (black) and ATP-bound (red) NBD*(1-417) showing the peak corresponding the C-terminal linker residue Leu417. (C) The isoleucine region of the methyl-TROSY spectra of the ADP- and ATP-bound BiP NBD*(1-417) (in black) overlaid with the spectra of the corresponding nucleotide-bound state of BiP NBD*(1-413) (in red). Asterisks highlight changes observed in the presence of the linker.

