. 2017 Oct 24;6:e29430. doi: 10.7554/eLife.29430

Figure 5. Allosteric regulation of the BiP by AMPylation.

(A) Populations of the domain-docked conformation for AMPylated and non-AMPylated BiP* and its V461F variant in the presence of ATP and ADP, calculated using methyl peak intensities of the domain-docked and -undocked conformations. Error bars show SDs from the means for three peak doublets (Materials and methods, Figure 5—figure supplements 12 and Figure 5—source data 1). (B) The thermodynamic linkage between domain docking and nucleotide binding: Plot of the experimental free energy of ATP (red dots) and ADP (black dots) binding against the experimental free energy of domain docking for BiP* and its non-AMPylated and AMPylated V461F variant. For each construct, the free energy of nucleotide binding was obtained from the ITC data and the free energy of domain docking was calculated from NMR peak intensities (see Figure 5—source data 2 and Materials and methods for details). The red (for ATP) and black (for ADP) curves show the theoretical plots of the free energy of ATP (red) and ADP (black) binding against the free energy of domain docking under assumption that BiP co-exists as an ensemble of the domain-undocked and -docked conformations (see Materials and methods).

Figure 5—source data 1. NMR analysis of populations for the domain-docked and -undocked conformations for AMPylated BiP.
The percentage of populations of the domain-docked conformation were calculated from methyl peak intensities of three non-overlapping peak doublets (P1, P2 and P3), each containing peaks for the domain-docked (D) and -undocked (U) conformations, using the following equation: pD=IDID+IU×100%, where ID and IU are the intensities of peaks corresponding to the domain-docked and -undocked conformations, respectively. Errors were set as standard deviations (SDs) from the means for three doublets or uncertainties from the errors in peak intensities, whatever is larger.
DOI: 10.7554/eLife.29430.023
Figure 5—source data 2. Analysis of the thermodynamic linkage between domain docking and nucleotide binding.
(Top) Thermodynamic parameters of ATP and ADP binding obtained from ITC experiments for FL BiP* and its non-AMPylated and AMPylated V461F variant; the measurements were repeated three times and the standard deviations for all parameters were less than 10%. (Bottom) Ratio of populations of the domain-docked (pD) and undocked (pU) conformations obtained from the analysis of NMR peak intensities (Figure 4—source data 1 and Figure 5—source data 1). (Grey) The experimental free energy of nucleotide binding and domain docking plotted in Figure 5B. The free energy of binding was calculated as ΔG(binding)/RT= Ln(Kd), where Kd is ADP or ATP binding constant obtained by ITC, R is the ideal gas constant, and T is the temperature in K; the free energy of domain docking was calculated from populations of the domain-undocked and -docked conformations obtained from the NMR analysis using the following equation: ΔG(docking)/RT= Ln(pD/pu).
elife-29430-fig5-data2.docx (106.3KB, docx)
DOI: 10.7554/eLife.29430.024

Figure 5.

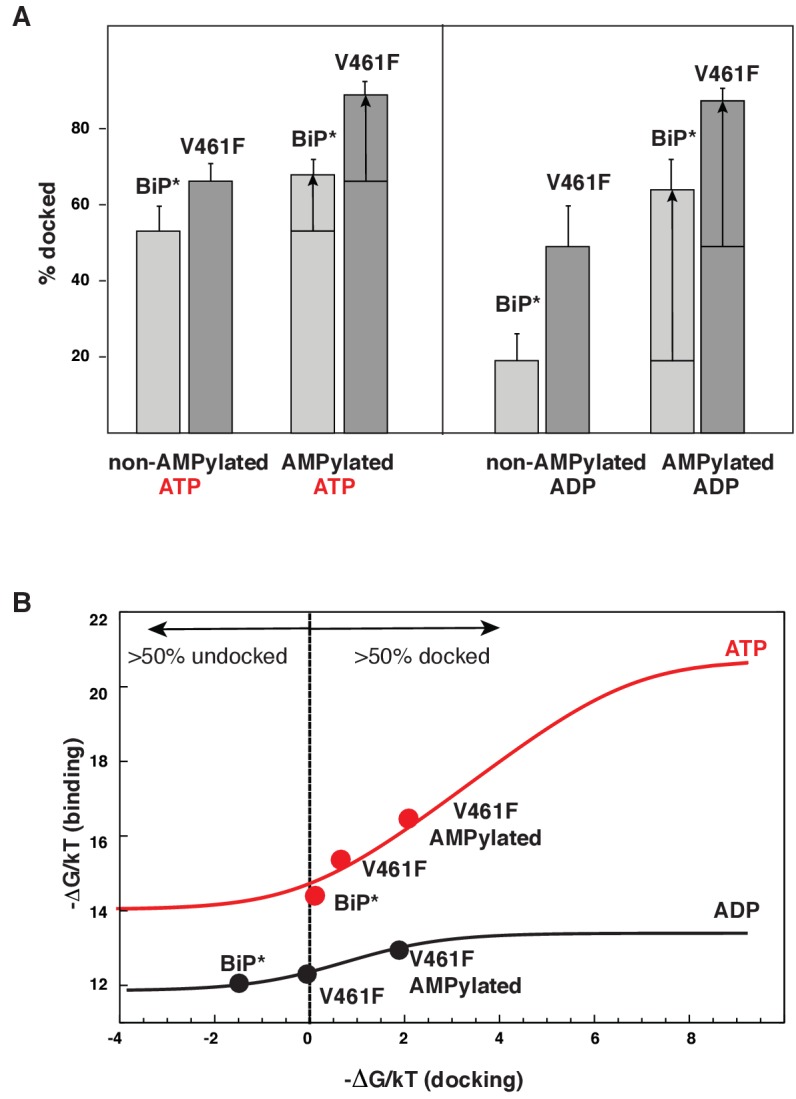
Figure 5—figure supplement 1. The isoleucine regions of methyl-TROSY spectra of ATP- and ADP-bound states of AMPylated full-length (FL) BiP* (A, in black), overlaid with the spectra of a corresponding nucleotide-bound state of NBD*(1-413) (B, in red).

Figure 5—figure supplement 1.

Peaks in the spectra of the FL protein were assigned to the domain-undocked (U) conformation when they were overlapped with peaks in the spectrum of the isolated NBD*(1-413) in the corresponding nucleotide state (ADP or ATP-bound). When two sets of peaks were observed in the NMR methyl spectra of the FL protein, the second peak with distinct chemical shifts from those observed for the isolated NBD*(1-413), was assigned to the domain-docked conformation (D). The three representative peak doublets used to calculate the population of the domain-docked conformation (Figure 5—source data 1) were labeled as P1 (an unassigned NBD Ile peak), P2 (Ile145) and P3 (Ile371).
Figure 5—figure supplement 2. The isoleucine regions of methyl-TROSY spectra of ATP- and ADP-bound states of AMPylated full-length (FL) V461F BiP* (A, in black), overlaid with the spectra of a corresponding nucleotide-bound state of NBD*(1-413) (B, in red).

Figure 5—figure supplement 2.

Peaks in the spectra of the FL protein were assigned to the domain-undocked (U) conformation when they were overlapped with peaks in the spectrum of the isolated NBD*(1-413) in the corresponding nucleotide state (ADP or ATP-bound). When two sets of peaks were observed in the NMR methyl spectra of the FL protein, the second peak with distinct chemical shifts from those observed for the isolated NBD*(1-413), was assigned to the domain-docked conformation (D). The three representative peak doublets used to calculate the population of the domain-docked conformation (Figure 5—source data 1) were labeled as P1 (an unassigned NBD Ile peak), P2 (Ile145) and P3 (Ile371).
Figure 5—figure supplement 3. The methyl TROSY spectrum of ATP-bound AMPylated BiP*-V461F (black) overlaid with the spectrum of ADP-bound AMPylated BiP*-V461F (red).

Figure 5—figure supplement 3.

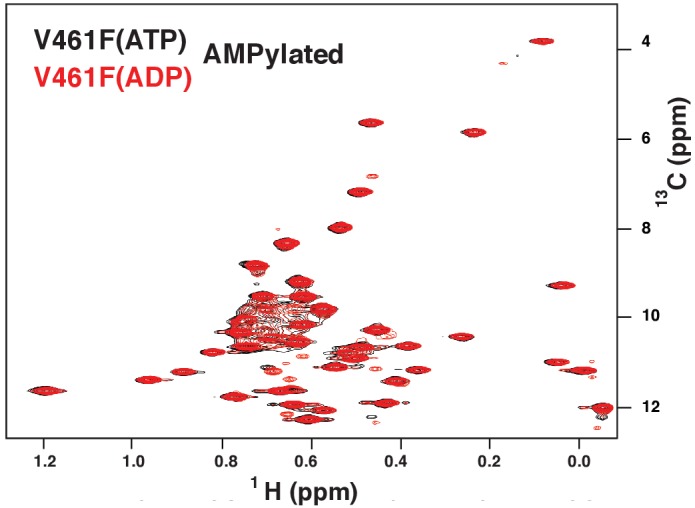
Figure 5—figure supplement 4. The amide TROSY spectrum of ATP-bound AMPylated BiP*-V461F (black) overlaid with the spectrum of ADP-bound AMPylated BiP*-V461F (red).

Figure 5—figure supplement 4.

Blowups of the representative regions of the TROSY spectra highlighting local chemical shift perturbations between ADP- and ATP-bound states.
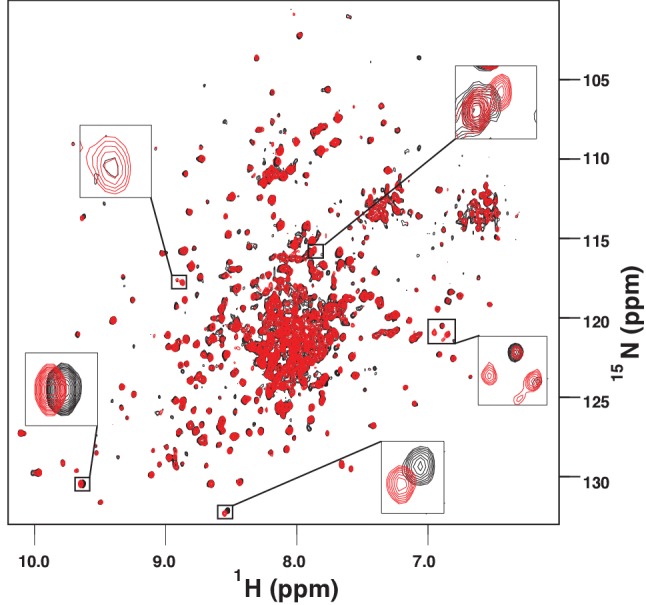
Figure 5—figure supplement 5. Representative panels showing nucleotide (ATP or ADP) binding to BiP* and isolated NBD*(1-413) and NBD*(1-417) measured by ITC. .

Figure 5—figure supplement 5.

Experiments were performed at 25°C using 20–80 μM protein in the cell and 0.1–0.4 mM ADP (or ATP) injected from the syringe. The top panels show raw data and the bottom panels show integrated normalized data.
Figure 5—figure supplement 6. Representative panels showing nucleotide (ATP or ADP) binding to non-AMPylated and AMPylated V461F BiP* measured by ITC. .

Figure 5—figure supplement 6.

Experiments were performed at 25°C using 30 μM protein in the cell and 0.25–0.35 mM ADP (or ATP) injected from the syringe. Top panels show raw data, and bottom panels show integrated normalized data.
Figure 5—figure supplement 7. LC-MS data for molecular mass determination of unmodified (panels A-B) and AMPylated (panels C-D) BiP. .

Figure 5—figure supplement 7.

Molecular mass difference of ~330 Da as reported before (Preissler et al., 2015) corresponds to modification by AMPlation. An additional peak at ±180 Da corresponds to α-N-Glucosylation of the His-tag.