
Figure 3. The interface between SUR1 and Kir6.2.
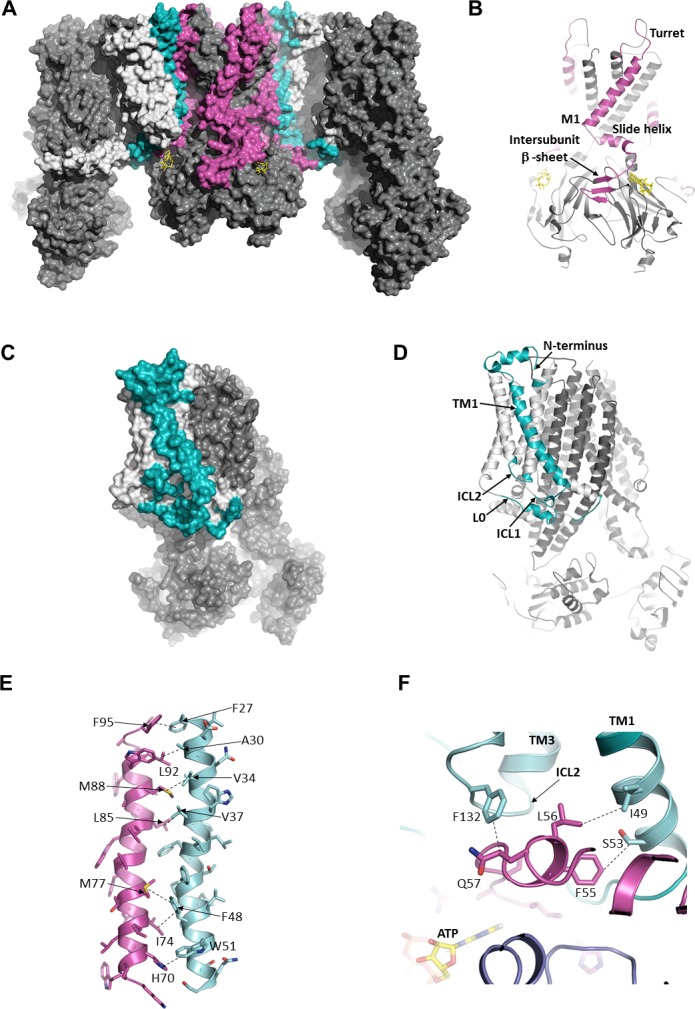
(A) Surface representation of the complex. SUR1-binding surface on Kir6.2 colored in magenta, and Kir6.2-binding surface on SUR1 is in cyan. TMD0/L0 is colored in light gray, and Kir6.2 and the ABC core of SUR1 are in dark gray. (B) Cartoon model of Kir6.2, with interface residues colored in magenta. The intersubunit β-sheet is formed by β strands A, N, and O shown in Figure 2—figure supplement 2. (C and D) Surface and cartoon models of SUR1, with interface residues in cyan. (E) Interface between M1 (Kir6.2; magenta) and TM1 (SUR1; cyan), highlighting key interactions. (F) Intersection of ICL2 (cyan) and N-terminus/slide helix (magenta), showing interaction between Q57 (Kir6.2) and F132 (SUR1). The dashed lines indicate selected van der Waals or electrostatic (H-bonding or charge-charge) interactions between two residues to aid visualization.