Figure 2. Two distinct NDC80 transcripts are expressed during meiosis.
(A) Ribosome profiling and mRNA-seq reads over the NDC80 locus during vegetative growth (top track) or meiotic S phase (bottom track). Data are derived from (Brar et al., 2012). (B) NDC80 mRNA isoforms and Ndc80 levels in meiosis. NDC80long and NDC80short levels were determined by northern blot, and Ndc80 level was determined by anti-V5 immunoblot at the indicated time points. To induce meiotic entry, IME1 and IME4 expression was induced in the strain UB1337 by addition of CuSO4 2 hr after cells were transferred to SPO. SCR1, loading control for northern blot. Kar2, loading control for immunoblot. One of the two repeated experiments is shown. * indicates a smaller RNA product, which likely represents a truncated form of NDC80long. (C) Representative smFISH images for NDC80long and NDC80short during vegetative growth and meiosis. Vegetative samples were taken when cells (UB8144) were growing exponentially in nutrient rich medium. Meiotic prophase samples were taken 6 hr after cells (UB8144) were transferred to SPO, a time when these cells were arrested in pachytene using the pGAL-NDT80 GAL4-ER system. Cells were then released by addition of β-estradiol, and meiosis I samples were taken 1.5 hr later. The Q 670 probes (shown in green) hybridize to the common region shared between NDC80long and NDC80short, whereas the CF 590 probes (shown in magenta) hybridize to the unique 5’ region of NDC80long (schematic is shown in the right panel). DNA was stained with DAPI (blue). Each cell was staged by its Zip1-GFP signal. Vegetative growth: Zip1-GFP negative. Meiotic prophase: Zip1-GFP positive. Meiosis I: Zip1-GFP negative and post NDT80 induction. Images here and throughout are shown as the maximum-intensity projections of z-stacks. Scale bar: 5 µm. (D) Quantification of smFISH data shown in (C), graphed as the relative frequency histograms of cells with a given number of NDC80long and NDC80short transcripts per cell, using data pooled from three independent experiments. The dashed line indicates the median number of NDC80long and NDC80short transcripts per cell. Each histogram here and throughout was normalized so that the maximum bin height is the same across all histograms. A total number of 637 cells were analyzed for vegetative growth, 437 for meiotic prophase, and 491 for meiosis I. Two-tailed Wilcoxon Rank Sum test was performed between each pair of conditions as indicated by the bracket. Refer to Supplementary file 1F for a summary of the median transcript levels for all the smFISH experiments.

Figure 2—figure supplement 1. Ribosome profiling and mRNA-seq reads over the NDC80 locus, during vegetative growth, starvation (MATa/MATa), and throughout meiosis.

Figure 2—figure supplement 2. During starvation, NDC80short and Ndc80 protein levels remain high, while NDC80long is not expressed.
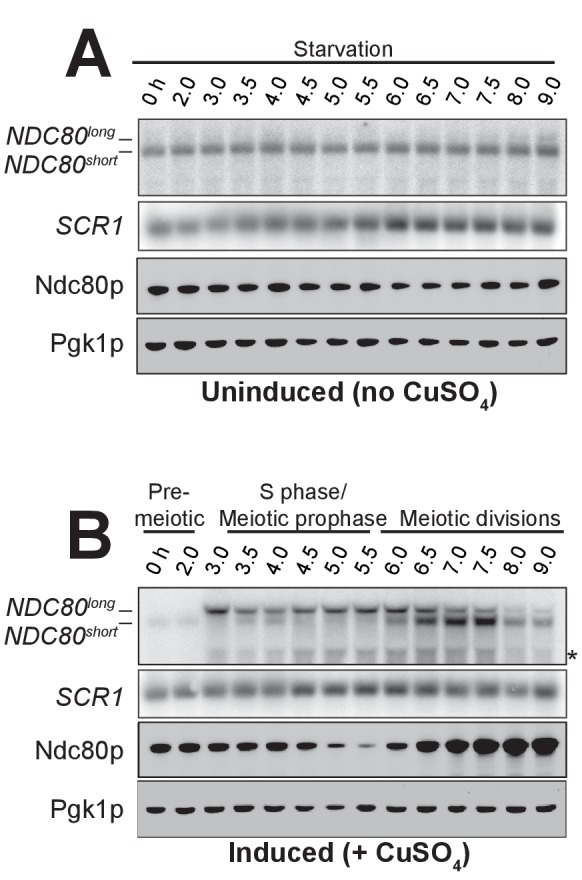
Figure 2—figure supplement 3. Progression of cells through meiosis as determined by spindle morphology and DAPI staining.

Figure 2—figure supplement 4. Percentage of the colocalized or non-colocalized smFISH spots obtained using the odd and even smFISH probe sets.
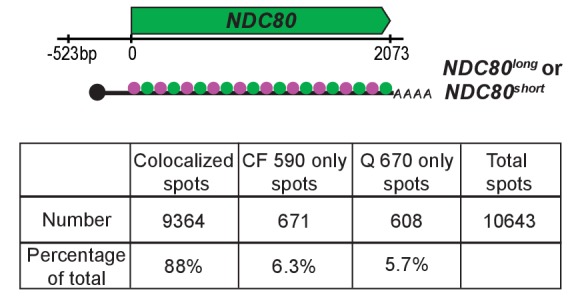
Figure 2—figure supplement 5. Bootstrapping analysis performed for the data obtained from the odd and even probe sets.
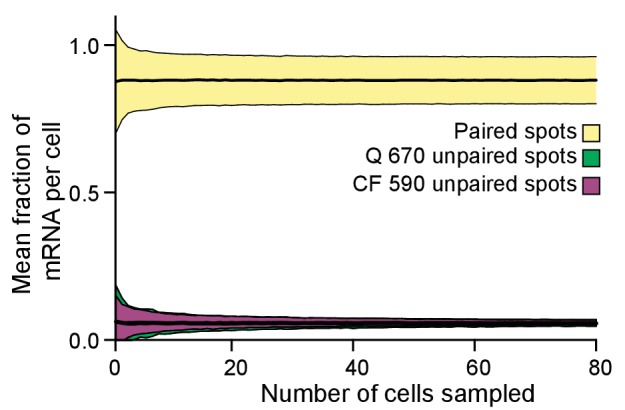
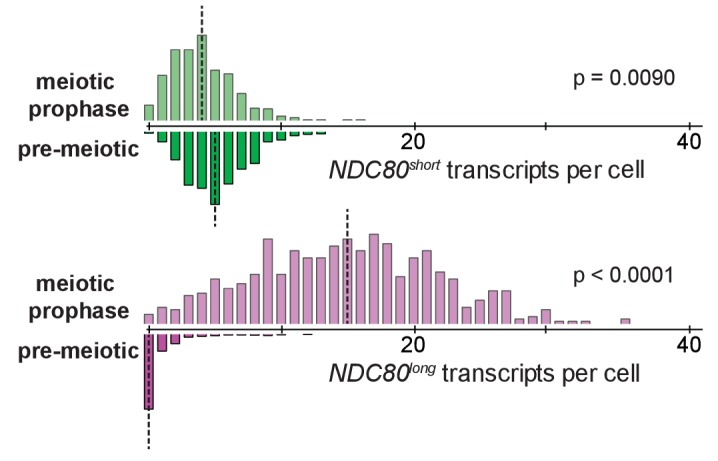
Figure 2—figure supplement 6. smFISH quantification for NDC80long and NDC80short in pre-meiotic starvation and meiotic prophase.