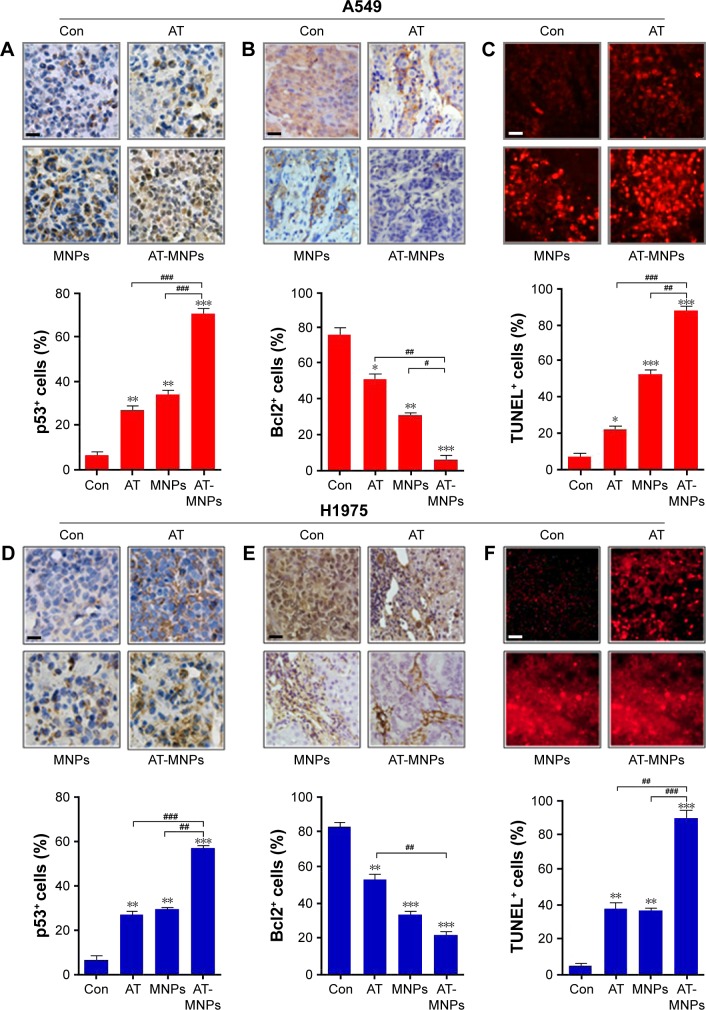
Figure 10.
AT-MNP therapy induced tumor cell apoptosis in tumor samples in vivo.
Notes: In A549 tumors, immunohistochemical analysis was used to calculate (A) p53 and (B) Bcl2 levels; quantification of positive p53 and Bcl2 cells shown. (C) Representative images of TUNEL-positive cells after different treatments and TUNEL levels from each group. In H1975-treated tumors, (D) p53 and (E) Bcl2 levels were detected through immunohistochemical assays; quantification of positive p53 and Bcl2 cells shown. (F) Representative images of TUNEL-positive cells from each group under different conditions and TUNEL levels after various treatments. Values are expressed as means ± standard error of mean. *P<0.05, **P<0.01, and ***P<0.001 vs Con group; #P<0.05; ##P<0.01; ###P<0.001. Analysis of variance and Dunnett’s analysis were included to compare the averages of multiple groups. The scale bars are all 25 μm.
Abbreviations: MNPs, magnetic nanoparticles; AT, actein; TUNEL, terminal deoxynucleotidyl transferase deoxyuridine triphosphate nick-end labeling; Con, control.

