
Figure 7.
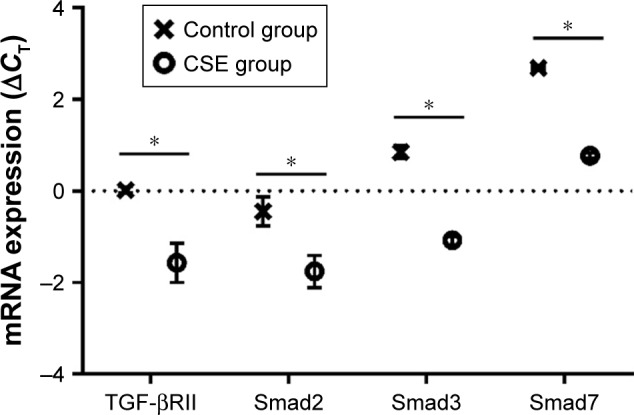
Comparison of mRNA level (ΔCT) of TGF-βRII, Smad2, Smad3 and Smad7 between the control group and CSE group.
Notes: An increased mRNA expression level of TGF-βRII, Smad2, Smad3 and Smad7 in the CSE group is shown. Statistical method: Student’s unpaired t-test. Error bars: mean ± SEM. n=5. *p<0.05, versus the control group.
Abbreviations: CSE, cigarette smoke extract; SEM, standard error of the mean.