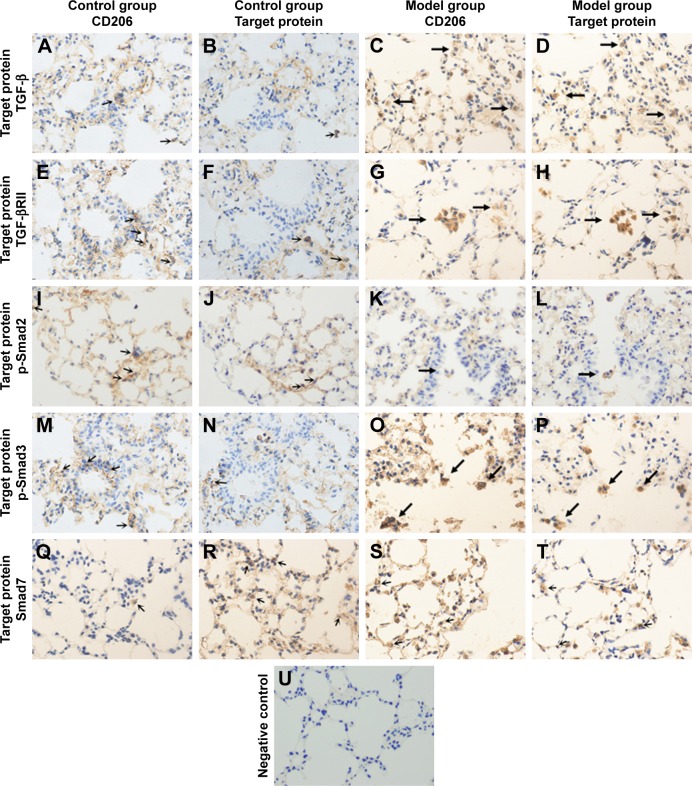
Figure 8.
Two continuous section-contrasted IHS of lung tissue of the model group and control group mice (400× magnification).
Notes: (A, E, I, M and Q) show the located label of M2 macrophages (CD206) in the control group and (C, G, K, O and S) that in the model group. (B, F, J, N and R) show the target proteins in the control group and (D, H, L, P and T) those in the model group. (B and D) show TGF-β. (F and H) show TGF-βRII. (J and L) show p-Smad2. (N and P) show p-Smad3. (R and T) show Smad7. (U) shows the negative control group. Indicating, in the model group, the percentage of double-positive/CD206-positive cells are all higher than those of the corresponding control group (double positive cells are marked by black arrows in model groups).
Abbreviation: IHS, immunohistochemical staining.

