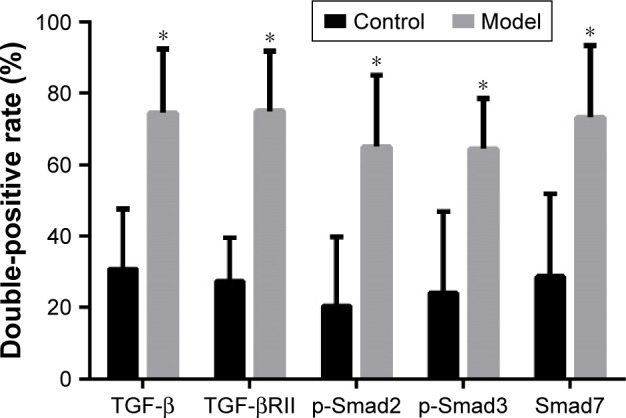
Figure 9.

Comparison of the percentage of double-positive/CD206-positive cells between the control group and the model group.
Notes: An increased protein expression level of TGF-β, TGF-βRII, p-Smad2, p-Smad3 and Smad7 in M2 macrophages in lungs of model group mice. Statistical method: Student’s unpaired t-test. Error bars: mean ± SEM. n=8. *p<0.05, versus the control group.
Abbreviation: SEM, standard error of the mean.
