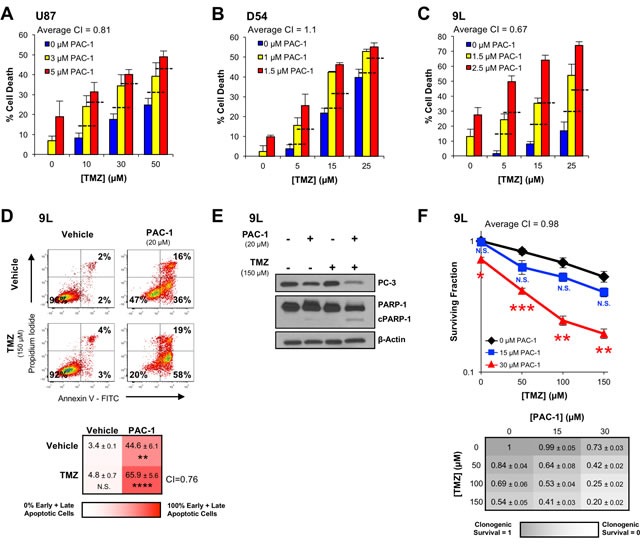
Figure 2. PAC-1 and TMZ induce synergistic cell death in glioblastoma cells.

A.-C. Glioblastoma cells (A: U87, human; B: D54, human; C: 9L, rat) were treated for 72 h with combinations of PAC-1 and TMZ (assessed by Alamar Blue). The dashed horizontal lines represent the level of cell death expected from an additive effect of compounds. The average Combination Index (CI) value across the combinations is indicated for each cell line. CI values < 1 are synergistic, with lower values indicating higher levels of synergy. CI values = 1 indicate an additive effect. D. The ability of PAC-1 and TMZ to induce apoptosis in 9L cells was assessed by flow cytometry with Annexin V-FITC and propidium iodide staining after a 48 h treatment. A substantial apoptotic population (FITC + / PI -) was observed with the combination treatment. Flow plots of representative data are shown. Mean of three independent experiments and standard error are indicated for each combination in the grid below. Statistical comparison to vehicle treated cells ** = p < 0.005, **** = p < 0.0005. E. 9L cells treated with PAC-1 and TMZ were analyzed via Western blot for the presence of markers of apoptosis, procaspase-3 activation and PARP-1 cleavage, after a 48 h treatment with compounds. F. Combination treatments of PAC-1 and TMZ were assessed for their ability to impact the clonogenic potential of 9L cells. Cells were treated for 12 h and clonogenic growth was assessed after 7 days. Mean and standard error are indicated for each combination in the table below. Statistical comparison to TMZ-only clonogenic survival * = p < 0.01, ** = p < 0.005, *** = p < 0.001. The average Combination Index (CI) value across the combinations is indicated in the grid below the graph. n = 3 biologic replicates for all experiments. N.S. indicates a not significant difference.
