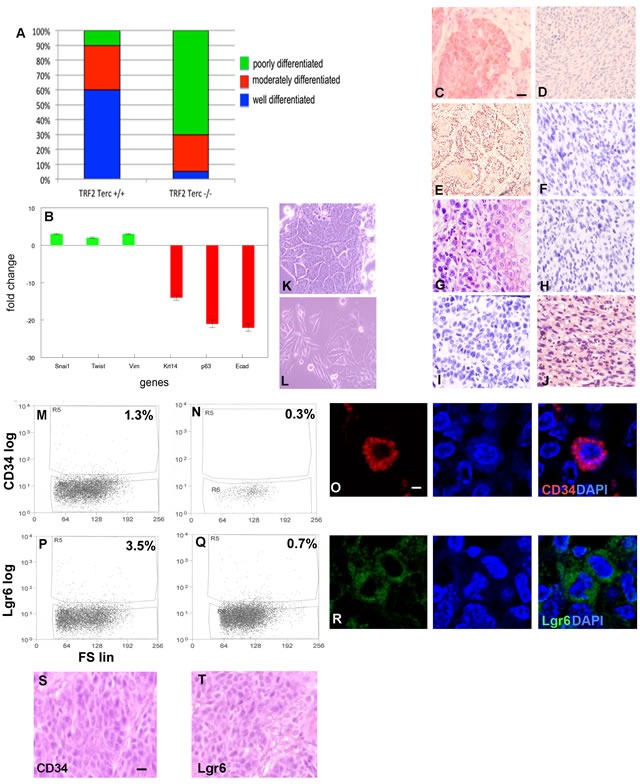
Figure 5. TRF2/Terc double null mutation induces EMT despite pronounced depletion of tumorigenic CD34+ and Lgr6+ cancer stem cells.

A. Percentage of histopathologically confirmed well, moderate, and poorly differentiated primary SCC in K14Cre;TRF2+/+;Terc+/+ and K14Cre;TRF2f/f;Terc-/- mice. B. Fold change in expression of EMT (Snai1, Twist, Vim) and epithelial differentiation (Krt14, p63, Ecad) mRNAs in K14Cre;TRF2f/f;Terc-/- compared to K14Cre;TRF2+/+;Terc+/+ SCC. Keratin 14 C., D. p63 E., F. E-cadherin G., H., and vimentin I., J. protein expression in K14Cre;TRF2+/+;Terc+/+ (left) and K14Cre;TRF2f/f;Terc-/- (right) SCC by immunohistochemistry. Scale bar = 10 μm. Cellular morphology of K14Cre;TRF2+/+;Terc+/+ K. and K14Cre;TRF2f/f;Terc-/- L. SCC in monolayer cultures is shown by phase contrast microscopy. Representative photomicrographs are shown. FACS analysis of CD34+ cancer stem cells from K14Cre;TRF2+/+;Terc+/+ M. and K14Cre;TRF2f/f;Terc-/- N. SCC. Fluorescence is shown by log scale (y axis) and forward scatter is shown by linear scale (x axis). The percent positive cells in each group are shown. O. Immunofluorescent localization of CD34+ cancer stem cells in primary SCC. Nuclei were counterstained with DAPI. Scale bar = 2 μm. FACS analysis of Lgr6+ cancer stem cells from K14Cre;TRF2+/+;Terc+/+ P. and K14Cre;TRF2f/f;Terc-/- Q. SCC. R. Immunofluorescent localization of Lgr6+ cancer stem cells in primary SCC. Reconstituted SCC from subcutaneous transplantation of sorted CD34+ S. and Lgr6+ T. cancer stem cells in immunodeficient mice is shown by H&E staining. Scale bar = 10 μm. Representative photomicrographs are shown.
