
Figure 10. Changes of mRNA and protein expression levels of IL-6 in the kidney at 21 and 42 days of the experiment.
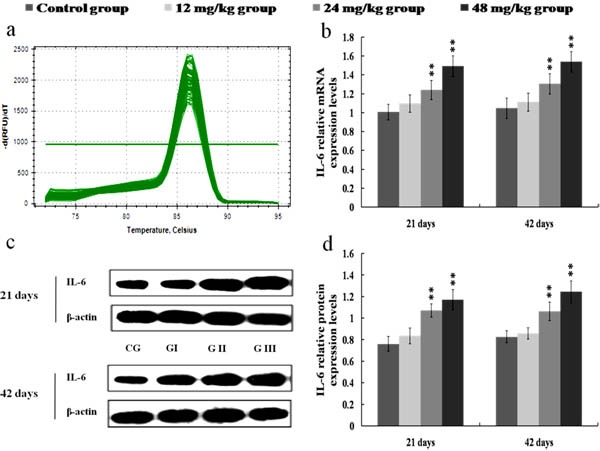
a. The melting curve analysis of IL-6. b. The relative mRNA expression levels of IL-6. c. The western blot assay of IL-6. d. The relative protein expression levels of IL-6. CG: Control group; GI: 12mg/kg group; GII: 24mg/kg group; GIII: 48mg/kg group. Data are presented with the mean ± standard deviation (n = 8). *p < 0.05, compared with the control group; **p < 0.01, compared with the control group.