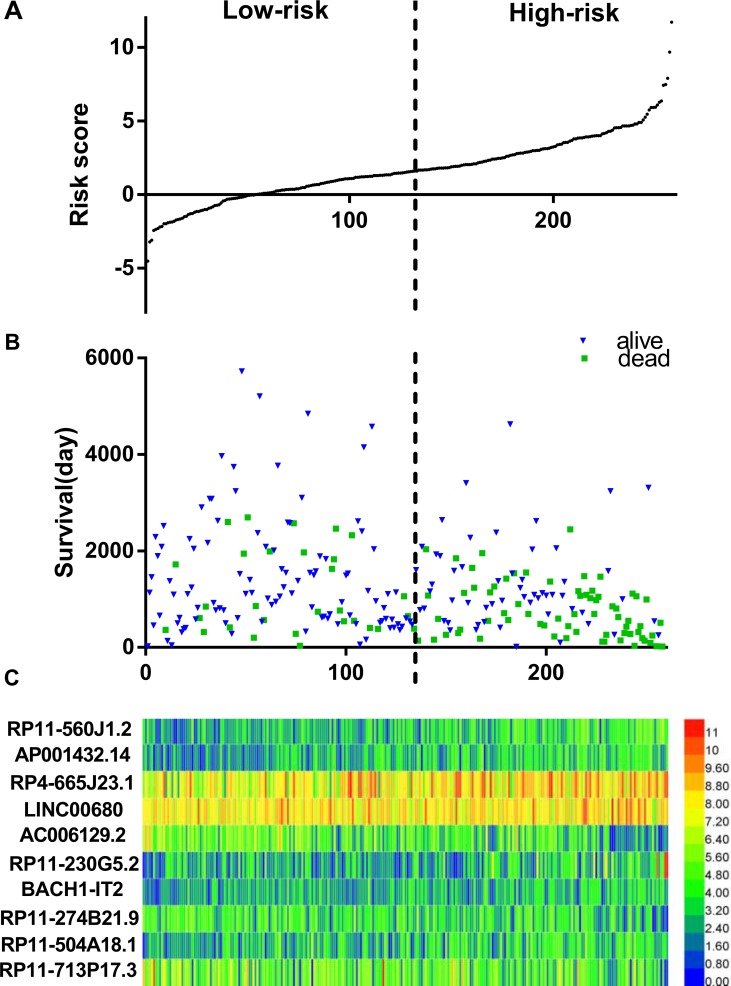
Figure 1. LncRNA predictive risk-score analysis of 258 soft-tissue sarcoma patients in TCGA cohort.
(A) LncRNA risk-score distribution; (B) Patients survival; (C) Heatmap of lncRNA expression profiles of sarcoma patients. The black dotted line represents the median signature cutoff dividing patients into low-risk and high-risk groups.

