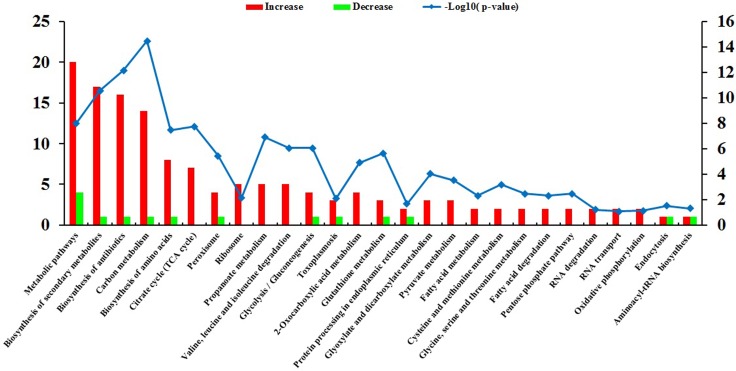
Figure 5. KEGG pathway analysis of the differentially expressed proteins (DEPs).
The horizontal axis represents the significantly enriched KEGG pathways. The left y-axis represents the number of DEPs and the right y-axis represents logarithmic corrected p-values for significant overrepresentation [–log10(p–value)].

