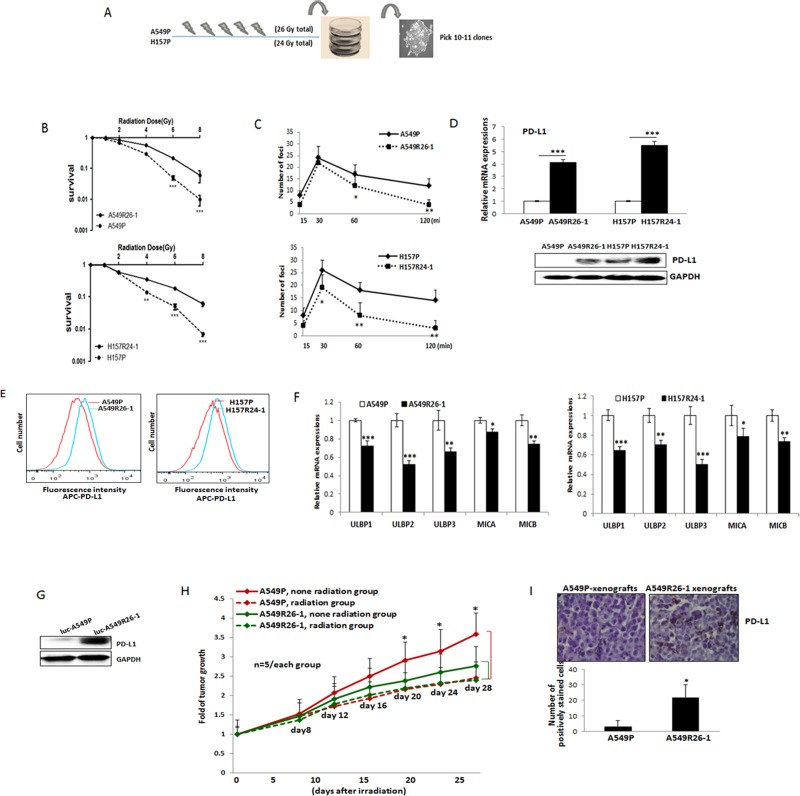
Figure 2. PD-L1/NKG2D ligand levels in radioresistant NSCLC sub-line cells and radioresistant cell-derived tumors (compared to parental cells and parental cell-derived tumors).
(A) An illustration of radioresistant sub-line development procedure. (B) Clonogenic assay showing radioresistance of A549R26-1 and H157R24-1 sublines vs. respective parental cells. 100 to 1,000 cells (A549P/A549R26-1 and H157P/H157R24-1) were plated and cell survivals after different doses of radiation treatment were analyzed in clonogenic assay. (C) γH2AX IF staining. The numbers of γH2AX foci (A549P/A549R26-1 and H157P/H157R24-1) at different time points after radiation (6 Gy) were analyzed. (D) PD-L1 expression in parental and radioresistant cells (upper panel, qPCR data; lower panel, Western blot data). (E) Flow cytometry results analyzing surface PD-L1 levels in parental (red) and radioresistant (blue) cells. (F) Expression of NKG2D ligands (mRNA) in parental vs. radioresistant cells. (G) Western blot analysis results showing the PD-L1 levels in injected luc-549R26-1 and luc-A549P cells. (H) Mice studies testing radioresistance. Tumor regression differences at each time point in A549P-xenografts vs. A549R26-1 xenografts, with or without radiation treatments (5 Gy × 5 days) is shown. Y-axis represents fold of tumor growth based on luminescence measurement. (I) IHC staining of PD-L1 in tumor tissues obtained from A549P cells-derived and A549R26-1 cells-derived xenografts. *p < 0.05, **p < 0.01, ***p < 0.001

