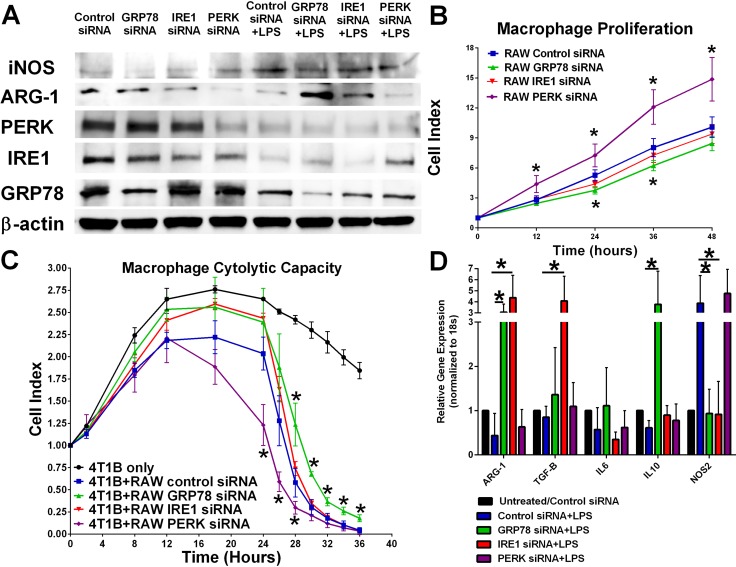
Figure 2. Knockdown of various UPR components differentially effects macrophage proliferation and plasticity.
(A) UPR signaling components IRE1, PERK, and GRP78 in RAW 264.7 cells were inhibited by RNAi treatment for 24 hours followed by treatment with 1 μg/mL LPS for 24 hours. iNOS, Arg-1, PERK, IRE1, and GRP78 were measured by Western blot hybridization. Protein loading was normalized to β-actin. (B) UPR signaling components IRE1, PERK, and GRP78 were inhibited by RNAi for 24 hours and then plated in an ACEA E-plate. Each well was treated with 1 μg/mL LPS and the cell index was measured every 12 hours by electrical impedance. n = 3; *p < 0.05. (C) 4T1B breast cancer cells were plated in an ACEA E-plate for 24 hours; then 5 × 10⁴control, IRE1, PERK, or GRP78 siRNA transfected RAW 264.7 macrophages were added to the E-plate. Each well was treated with 1 μg/mL LPS and the cell index was measured every 4 hours by electrical impedance. n = 3; *p < 0.05. (D) RT-PCR analysis of iNOS, ARG-1, IL-6, IL-10, and IL-12 gene expression in control, IRE1, PERK, or GRP78 siRNA transfected RAW 264.7 cells treated with 1 μg/mL LPS for 24 hours. Gene expression was normalized to 18S housekeeping gene. n = 4; *p < 0.05.

