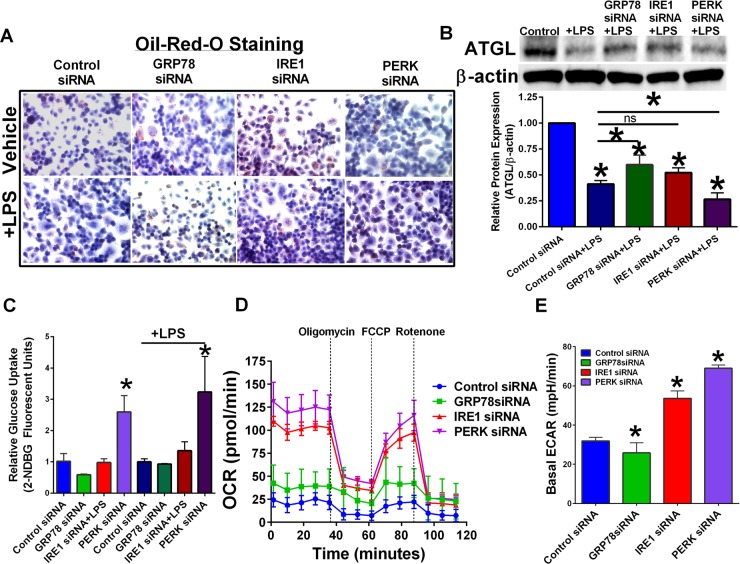
Figure 3. Targeting UPR signaling components differentially regulate cellular metabolism.
(A) RAW 264.7 macrophage cells were transfected with control, GRP78, IRE1, or PERK siRNA for 24 hours, and then treated with or without LPS. Intracellular lipids were stained for oil-red-o and representative images obtained at 40×. (B) UPR signaling components IRE1, PERK, and GRP78 in RAW 264.7 cells were inhibited by RNAi treatment for 24 hours followed by treatment with 1 μg/mL LPS for 24 hours. ATGL was measured by Western blot hybridization. Protein loading was normalized to β-actin. (C) Glucose uptake in RAW 264.7 cells transfected with scrambled control or UPR targeting siRNA for 24 hours. n = 3; *p < 0.05. (D) Mitochondrial metabolomics was determined in transfected RAW 264.7 macrophages using a Seahorse Bioanalyzer. (E) Basal ECAR rates in transfected RAW 264.7 macrophage cells. n = 3–4; *p < 0.05.

