
Figure 11. Representative images of NO effects on migration and invasion.
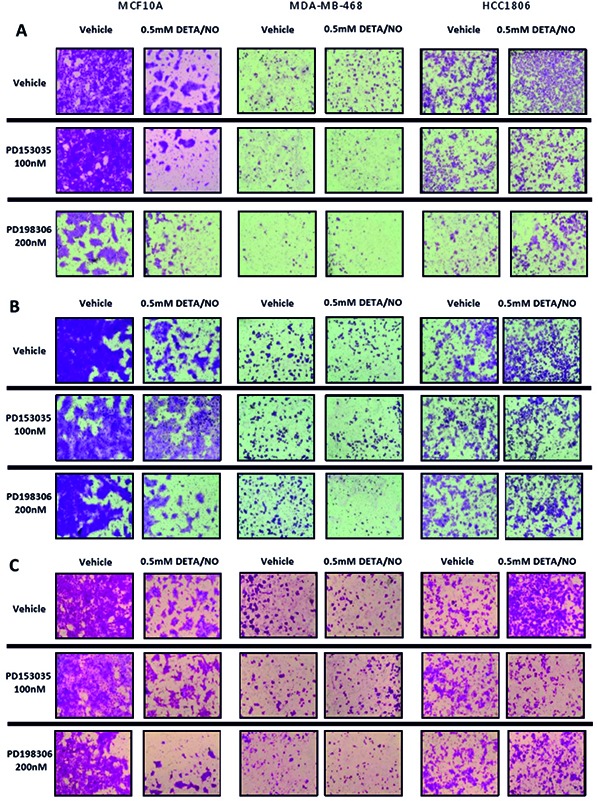
Representative images of migratory and invasion potential (A) and invasive potential of the cell lines to invade through a 0.2% gelatin (B) or 1mg/ml collagen (C) of the cell lines after 24 hours exposure to vehicle or 0.5mM of DETA/NO alone or in combination with 100nM of PD153035 or 200nM PD198306.