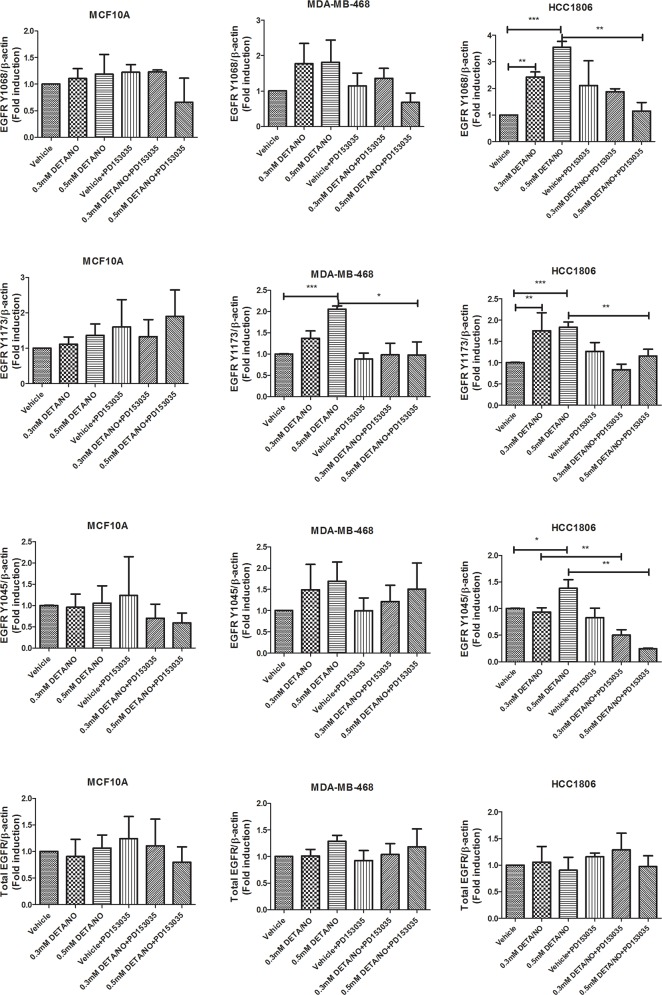
Figure 4. Densitometry analysis of EGFR phosphorylation in response to DETA/NO.
Quantification of western blots (Figure 3A) examining EGFR phosphorylation at Y1068, Y1173 and Y1045 and total EGFR expression in the MCF-10A, MDA-MB-468 and HCC1806 cell lines after 24 hours exposure to increasing doses of DETA/NO alone or in combination with 100nM of PD153035 (EGFR inhibitor).

