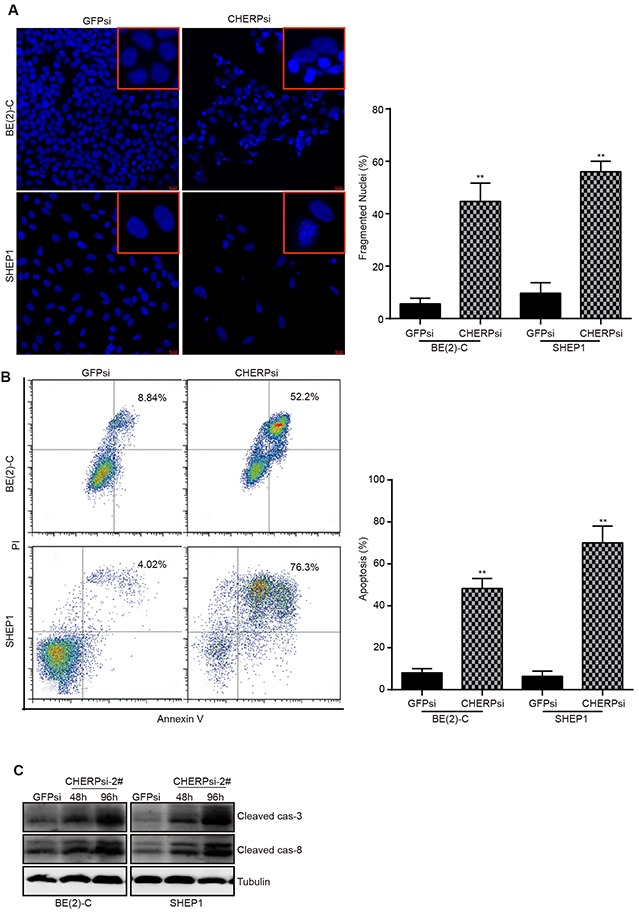
Figure 4. CHERP depletion induces neuroblastoma cells apoptosis.

(A) Hoechst 33258 staining for BE(2)-C and SHEP1 cells; regions of cells are magnified in the red frames. Scale bar for all microscopy images, 10 μm. Quantification of Hoechst 33258-stained cells is shown on the right; all data were measured at least three times and were obtained from three independent images. (B) Apoptosis analysis of BE(2)-C and SHEP1 cells using flow cytometry. Quantification of apoptotic cells is presented on the right, and all data were analyzed using Student's t-test, **P < 0.001. (C) Expression of apoptosis-associated proteins (cleaved caspase-3 and cleaved caspase-8) as detected using western blotting.
