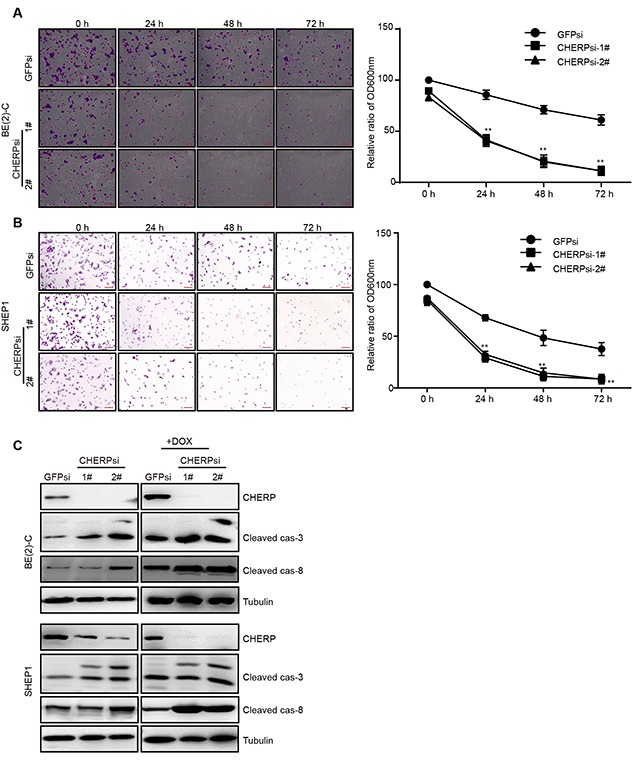
Figure 5. CHERP depletion results in alterations in the sensitivity of neuroblastoma cells to DOX.

Clonogenic assays of BE(2)-C (A) and SHEP1 (B) cells expressing GFPsi, CHERPsi-1# or CHERPsi-2# sequences and treated with 2 μM Dox for the indicated time (0 h, 24 h, 48 h or 72 h); colonies were stained with crystal violet solution and quantified. Scale bar for all microscopy images, 100 μm. Quantification of the stained colonies is shown in the right panel. All data are shown as the mean ± SD, **P ≤ 0.001. All p-values are based on analysis of control versus treatment. (C) Western blot analysis was performed to determine the expression of apoptosis-associated proteins (cleaved caspase-3 and cleaved caspase-8).
