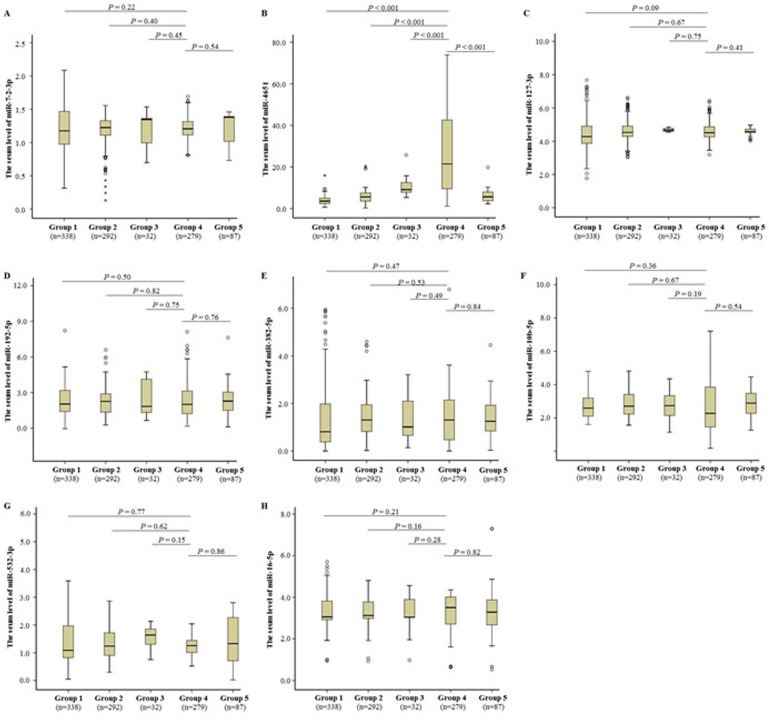
Figure 1. Differentially expressed microRNAs in the serum samples.
Eight differentially expressed microRNAs in the discovery, including miR-7-2-3p A., miR-4651 B., miR-127-3p C., miR-192-5p D., miR-382-5p E., miR-10b-5p F., miR-532-3p G., and miR-16-5p H., were further analyzed using TaqMan-PCR method in the training stage. The relative levels of microRNA expression were calculated according to 2−ΔCT method (see Materials and Methods). The microRNA data are shown as box plots, with horizontal lines representing the median, the bottom and the top of the boxes representing the 25th and 75th percentiles, respectively. We compared expression data between groups using the Mann-Whitney U test.

