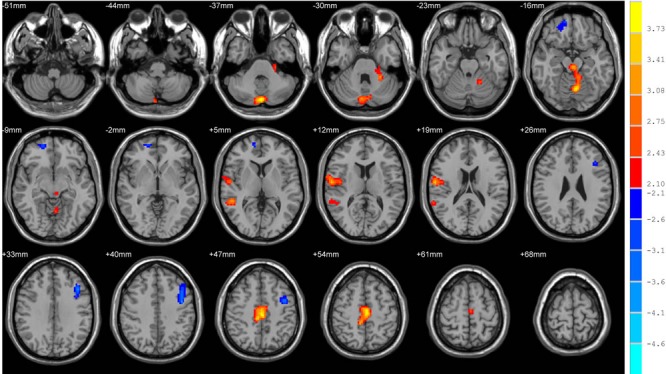
Figure 1. Brain areas with significant changes of ReHo values after chemotherapy in paired t tests.

Warm and cool colors indicate significantly decreased and increased ReHo values at P < 0.05 (AlphaSim corrected, cluster size>1458 mm3, spatial smoothness = 4, rmm = 4).
