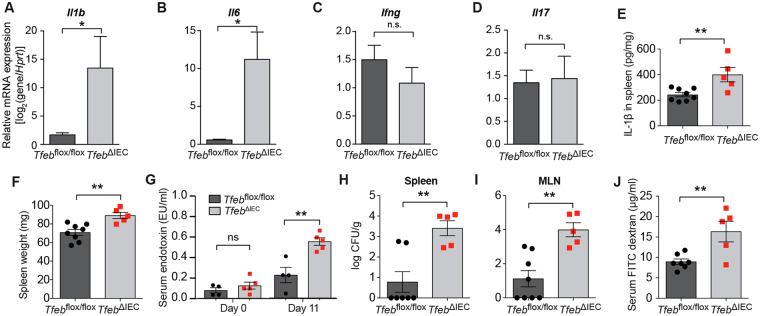
Figure 3.
Increased inflammation and bacterial translocation in Tfeb ΔIEC animals. (A–D) qRT-PCR from colonic tissue of genes Il1b (a), Il6 (b), Ifng (c), and Il17 (d) relative to reference gene Hprt. Data are means of three biological replicates, error bars are S.E.M. *p < 0.05 (two-sample t test). (E) Il-1β ELISA using splenic extracts from Tfeb ΔIEC and Tfeb flox/flox animals. Tfeb flox/flox mice N = 8, Tfeb ΔIEC mice N = 5. Data are means, error bars are S.E.M. **p < 0.01 (two-sample t test). (F) Splenic weights from Tfeb ΔIEC and Tfeb flox/flox animals. Data are means, error bars are S.E.M. **p < 0.01 (two-sample t test). (G) Baseline and day 11 serum endotoxin levels. Data are means, error bars are S.E.M. **p < 0.01 (two-sample t test). (H,I) Bacterial colony-forming units (CFU) per g of tissue in spleens (H) and mesenteric lymph nodes (I). Tfeb flox/flox mice N = 7, Tfeb ΔIEC mice N = 5 (H). Tfeb flox/flox mice N = 8, Tfeb ΔIEC mice N = 5 (I). Data are means, error bars are S.E.M. **p < 0.01 (two-sample t test). (J) Intestinal permeability measured by FITC dextran in serum. Tfeb flox/flox mice N = 7, TfebΔIEC mice N = 5. Data are means, error bars are S.E.M. **p < 0.01 (two-sample t test).

