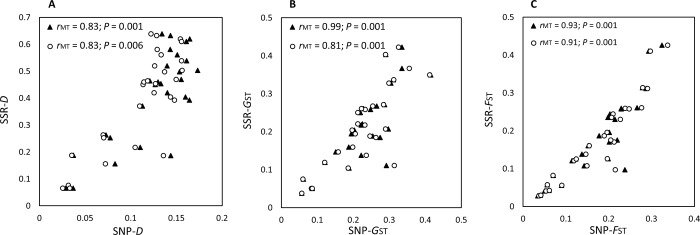
Fig 4. Relationships between indices of population differentiation.
(A) Jost’s D, (B) Pairwise Nei’s GST, and (C) Pairwise FST between Cercospora beticola populations estimated using 12 microsatellites (SSR) and single nucleotide polymorphisms (SNPs) identified using genotyping-by-sequencing. Values were estimated using the strict SNP data set (filled triangles) and relaxed-filtered SNP data set 1 (open circles). Values estimated using the relaxed-filtered SNP data set 2 were almost identical to those obtained from data set 1.

