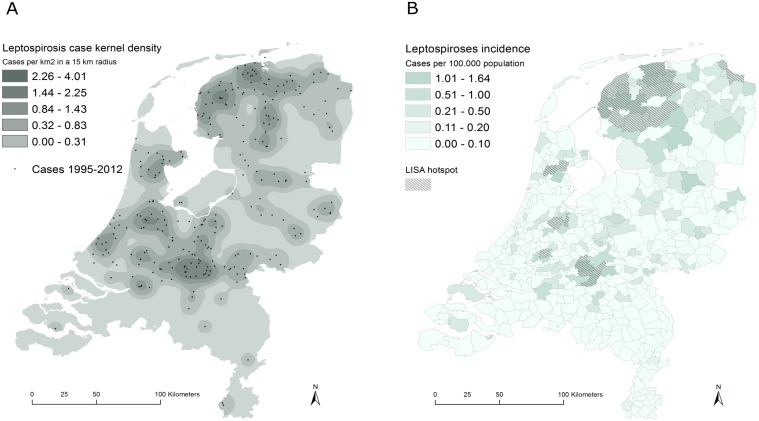
Fig 1. Kernel density estimates.
(A) kernel density estimate and point location of Lyme cases and (B) spatial distribution of incidence rates across the Netherlands. Hotpots or clusters of municipalities with increased incidences as identified using the Local Indicators of Spatial Autocorrelation (LISA) analysis are indicated.

