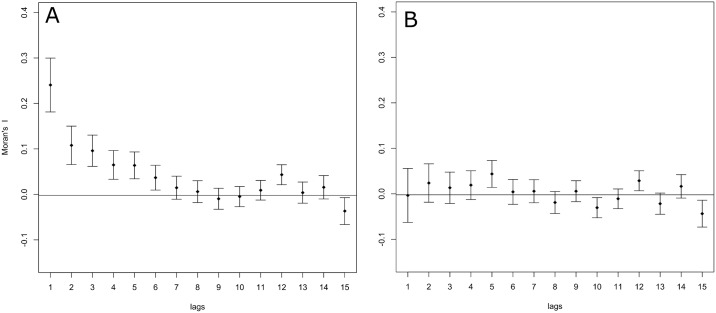
Fig 2. Correlogram showing the spatial auto-correlation of leptospirosis incidence rates.
(A) before and (B) after fitting the multivariate model (e.g. residual variation) between municipalities over incremental distances. Lag orders correspond to the order of municipality adjacency ranging from 1st to 15th order neighboring municipalities.

