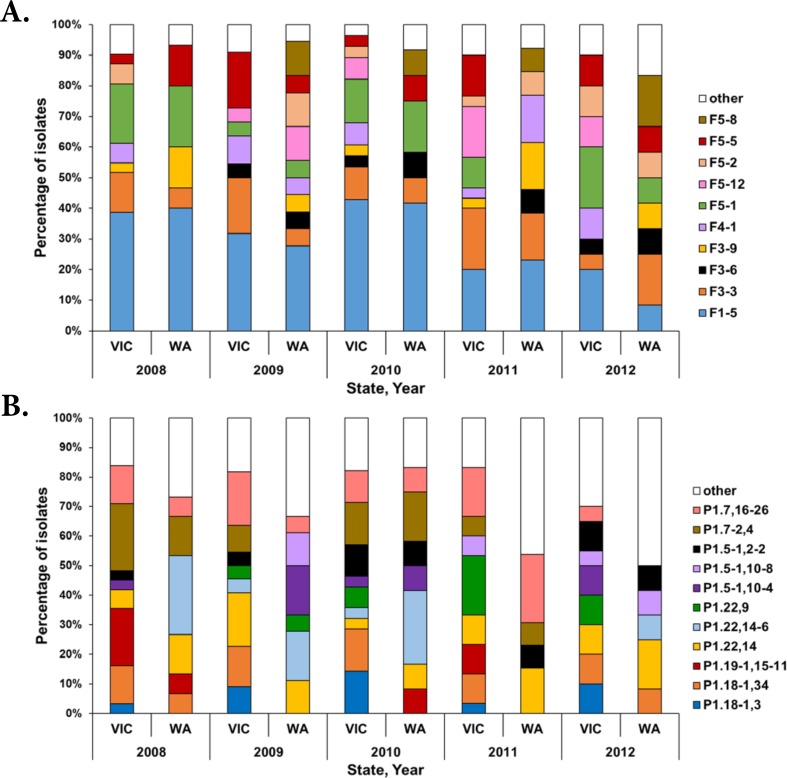
Fig 4.
Distribution of FetA (panel A) and PorA (panel B) types among meningococcal isolates in VIC and WA (2008–2012). The bars are coloured based on the FetA and PorA types identified in ≥ 5 isolates. The category “other” indicates 12 FetA and 11 PorA types which were observed in < 5 isolates. This analysis includes isolates from 2008, 2009, 2010, 2011 and 2012 from VIC (n = 31, 22, 28, 30 and 20, respectively) and WA (n = 15, 18, 12, 13 and 12, respectively).

