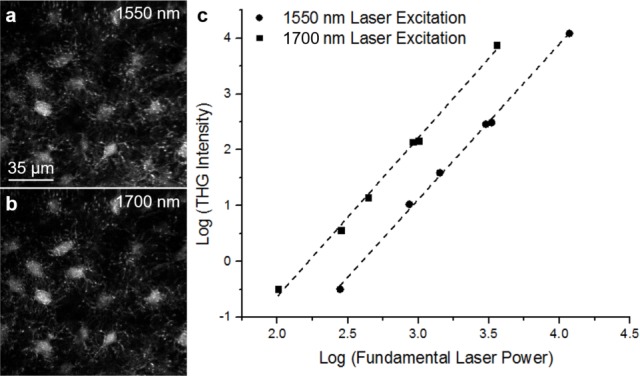
Fig 2. THG power dependency plot.

THG images of osteocytes obtained at 1550 nm (a) and 1700 nm (b) excitation in vivo as well as a logarithmic plot (c) of the THG intensity of an osteocyte with fundamental laser power for both 1550 nm and 1700 nm excitation. The data was fit with a line corresponding to a slope of 2.8 ± 0.2 for 1550 nm excitation and 2.9 ± 0.2 for 1700 nm excitation.
