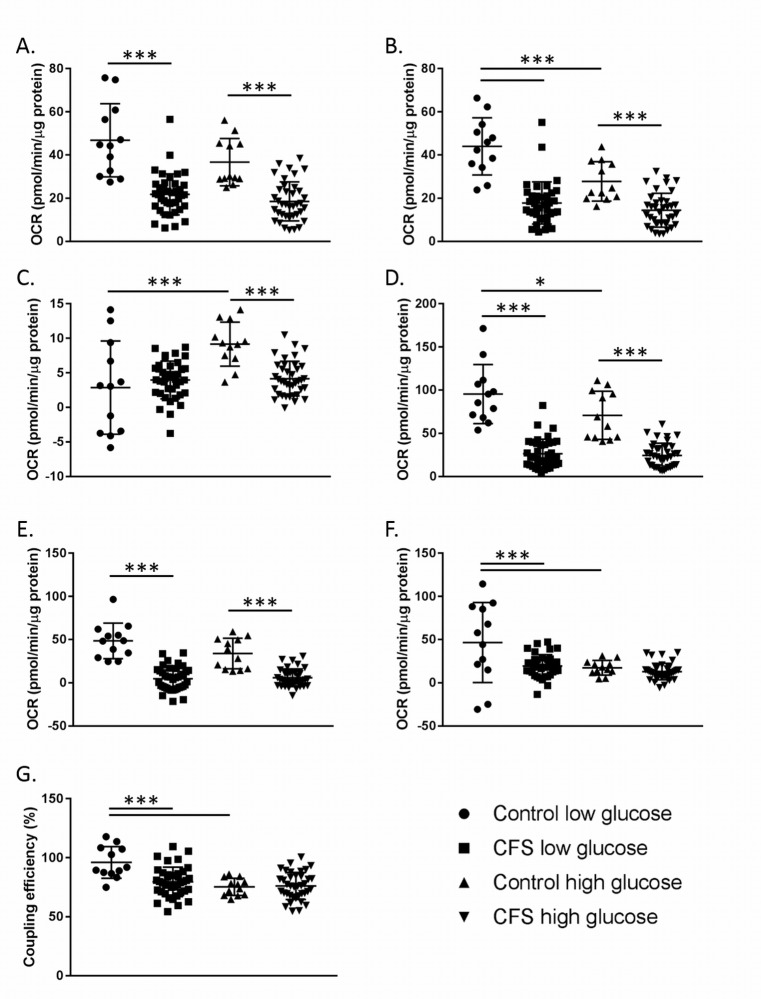
Fig 5. Results from a mitochondrial stress test conducted using CFS and control PBMCs incubated for 24 hours in low (1mM) and high (10mM) glucose.
A. Basal respiration. B. ATP production. C. Proton leak. D. Maximal respiration. E. Reserve capacity. F. Non-mitochondrial respiration. G. Coupling efficiency. Control low glucose n = 12; CFS low glucose n = 39; Control high glucose n = 12; CFS high glucose n = 38. * denotes p ≤ 0.05; *** denotes p ≤ 0.005. Groups were compared using a two-way ANOVA with LSD test and post-hoc Bonferroni correction for multiple comparisons.

