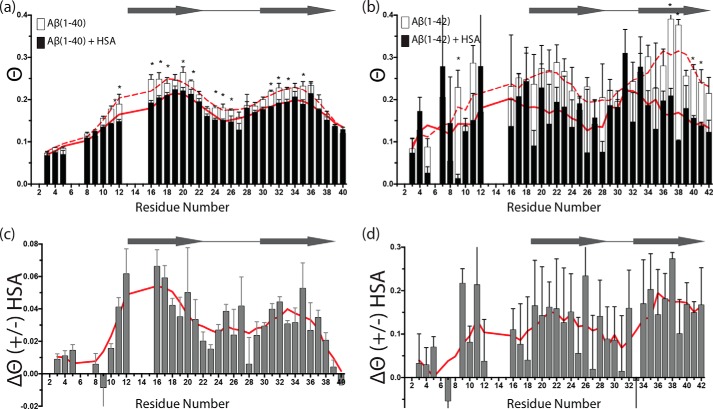
Figure 3.
Effect of HSA on the single point DEST (ϴ) profiles of concentrated Aβ(1–40) and Aβ(1–42) in a dynamic pseudo-equilibrium state between monomers and protofibrils (dark state). a, ϴ values for 300 μm Aβ(1–40) in the absence (white bars) and presence (black bars) of 70 μm HSA. b, ϴ values for 150 μm Aβ(1–42) in the absence (white bars) and presence (black bars) of 50 μm HSA. c and d, residue-specific differences between the two ϴ profiles of a and b, respectively. In a and b, smoothed lines in the absence (dashed red line) and presence of HSA (solid red line) are displayed behind the bars, whereas smoothed lines are displayed as solid red lines in c and d. Smoothed lines were calculated by averaging ϴ values between the measured ϴ value of one residue and those for the two amino acids adjacent to it, when available. Horizontal arrows and empty circles have the same meaning as in Fig. 1. The data are means of 2–3 replicates ± S.E. a and b were analyzed for statistical significance using a Student's t test. Asterisks denote statistical significance with p < 0.05.

