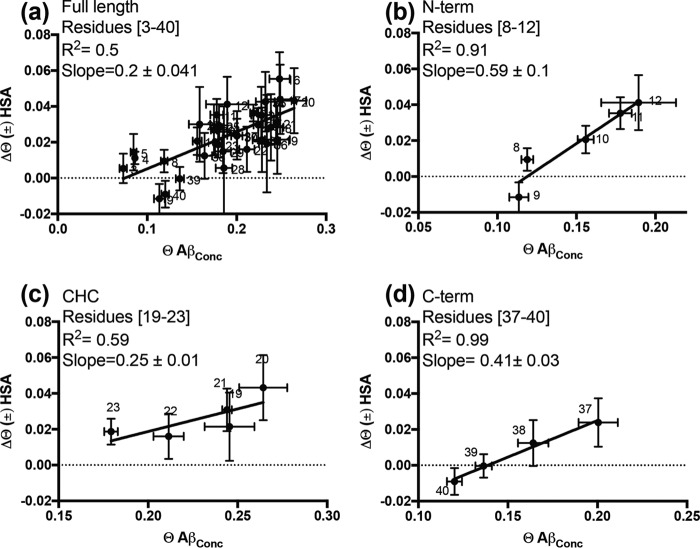
Figure 4.
Correlation between the ϴ changes caused by HSA addition (Δϴ (±) HSA) and the dark ϴ values measured in the absence of HSA. a, correlation for the full-length Aβ(1–40) peptide. b–d, correlations for selected segments of Aβ(1–40): 8–12, 19–23, and 37–40, respectively. Assuming ϴ values become null at infinite dilution, the dark ϴ values reported on the horizontal axis represent the ϴ value variations occurring upon dilution in the absence of albumin, i.e. the Δϴ Aβ(1–40) dilution values.

