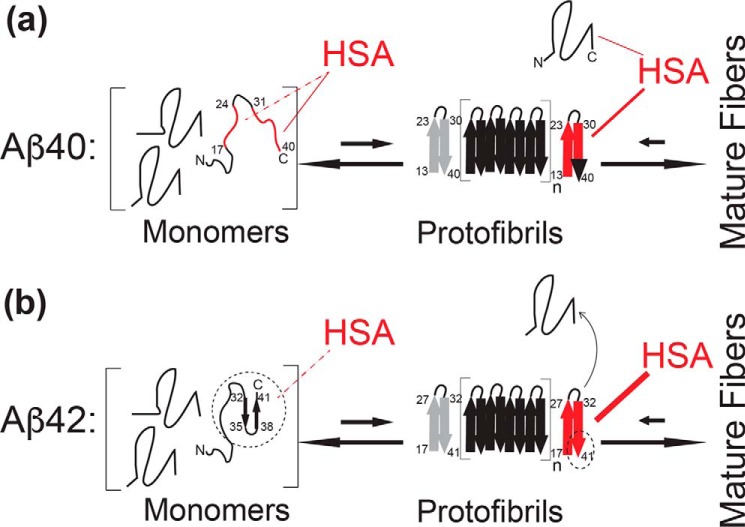
Figure 5.
Schematic model for the mechanism of Aβ(1–40) versus Aβ(1–42) self-association inhibition by HSA. Key Aβ regions affected by HSA are shown in red. a, model of Aβ(1–40)- HSA interactions. HSA binds weakly (KD = ∼0.1–1 mm) to the largely unstructured Aβ(1–40) monomers targeting primarily the C-terminal 31–40 residues (solid red line), as well as a secondary site spanning residues 17–24 (dashed red line). HSA also binds Aβ(1–40) protofibrils with higher affinity than Aβ(1–40) monomers (Aβ401) and competes with the direct contacts between Aβ401 and the Aβ(1–40) protofibrils, thus inhibiting further growth into mature fibers that would otherwise occur under non-pseudo-equilibrium conditions in the absence of HSA, as explained in the text. However, HSA may also mediate indirect contacts between the Aβ401 and the Aβ(1–40) protofibrils. The Aβ(1–40) residues involved in fibril cross-β structures are represented by thick arrows (23, 47, 48). One edge of the protofibril is displayed in gray to denote that HSA may not interact with both edges (12). b, model of Aβ(1–42)- HSA interactions. The last two residues of Aβ(1–42) stabilize a C-terminal turn in the monomeric peptide, possibly shielding the C-terminal region from HSA and reducing the affinity of Aβ(1–42) monomers for HSA (dashed thin line rather than solid thick red line). However, the last two residues of Aβ(1–42) also promote extensive HSA-induced protofibril perturbations (thicker red line), which now reach the C-terminal region of the second β-strand (full red rather than red/black C-terminal arrow). The black dashed circles/ovals highlight the sites of the Aβ(1–40) versus Aβ(1–42) differences.

