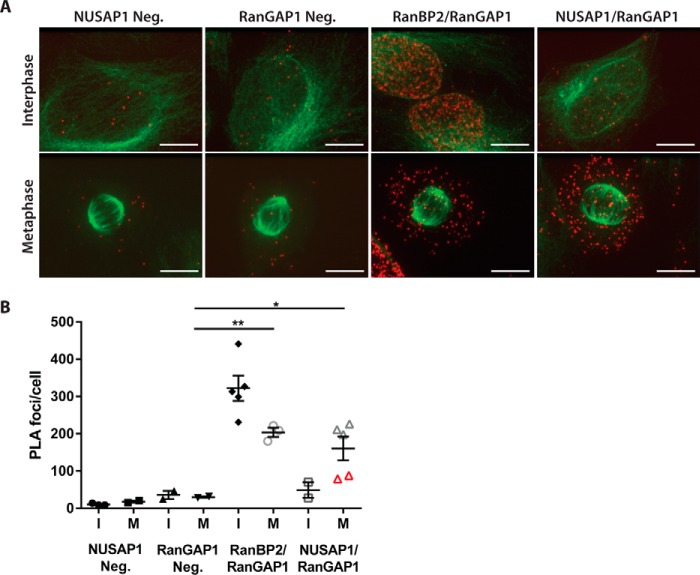
Figure 4.
NUSAP1 and RanBP2 interact in the cytosol of mitotic cells. A, PLA in U2OS cells using endogenous against NUSAP1, RanGAP1, RanBP2, or control IgG. Tubulin is shown in green with the PLA signal in red. (Scale bars indicate 10 μm.) B, average number of foci/cell for each PLA condition shown in A. Foci were counted using ImageJ.

