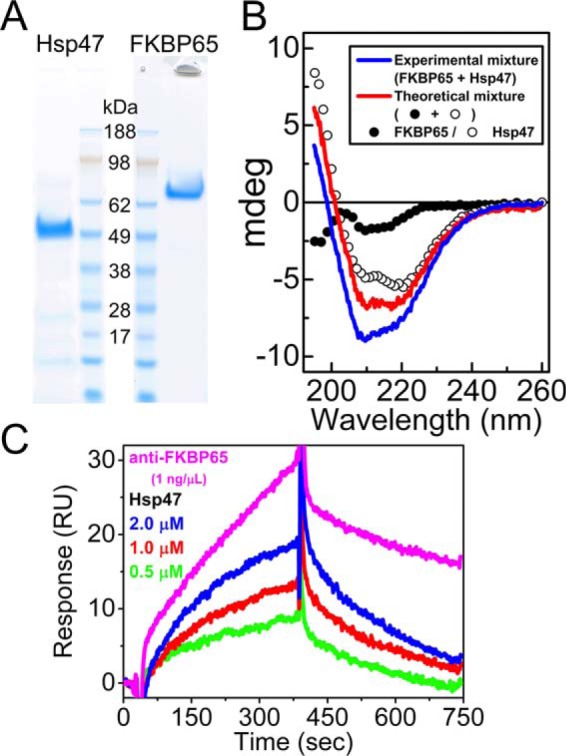
Figure 2.

Determination of a direct interaction between Hsp47 and FKBP65. A, purified endogenous chick Hsp47 and FKBP65 were electrophoresed on a Bolt 4–12% Bis-Tris Plus Gel and stained with GelCode Blue Stain Reagent. B, CD spectra of 0.6 μm chick Hsp47 (open circles) and 0.6 μm chick FKBP65 (closed circles). Red and blue curves indicate the theoretical signal derived from addition of individual Hsp47 and FKBP65 signals, and the experimental signal from a mixture of Hsp47 and FKBP65, respectively. C, direct binding kinetics were measured by SPR analysis using a BIAcore X instrument. Various concentrations of Hsp47 were run over the FKBP65 chip. The following binding curves are shown: 0.5 μm (green), 1.0 μm (red), and 2.0 μm (blue) Hsp47. An antibody against FKBP65 (magenta line) was used as a positive control.
