Figure 3.
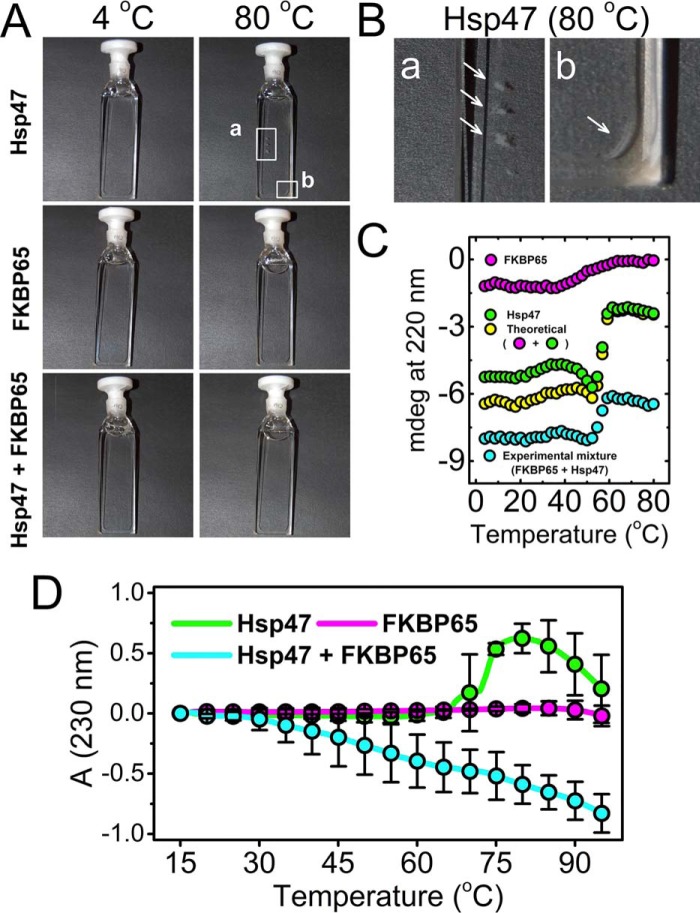
Thermal stability of Hsp47 and FKBP65. The thermal stabilities of Hsp47 and FKBP65 and a mixture of Hsp47 and FKBP65 were measured using circular dichroism and absorbance measurements. The final concentrations of Hsp47 and FKBP65 were 0.6 μm and 0.5 μm for CD and absorbance measurements, respectively. A, pictures of the protein solutions were taken at the beginning (4 °C) and the end (80 °C) of the thermal transition experiment. B, images showing aggregates of Hsp47 that are magnified views of areas a and b from A. The arrows highlight aggregates of Hsp47. C, the thermal transition of Hsp47 (green), FKBP65 (magenta), and an experimental mixture of Hsp47 and FKBP65 (cyan) was monitored as a function of temperature by circular dichroism at 220 nm. The yellow curve indicates the theoretical signal derived from addition of individual Hsp47 and FKBP65 signals. D, the protein aggregation and/or unfolding transition of Hsp47 (green), FKBP65 (magenta), and an experimental mixture of Hsp47 and FKBP65 (cyan) was monitored as a function of temperature by absorbance (turbidity) at 230 nm. All curves were averaged from a minimum of three measurements, and error bars indicating S.D. are shown at each 5 °C interval.

