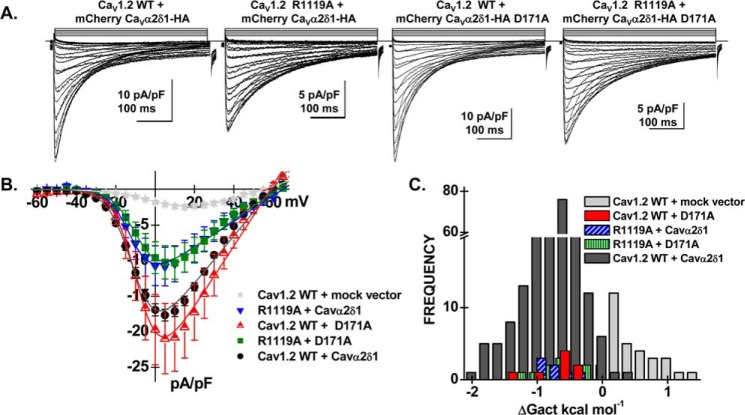
Figure 9.
Double mutant analysis of charged residues in repeat III in CaV1.2. HEKT cells were transiently transfected with CaVβ3, pCMV–CaV1.2 WT or mutant and pmCherry–CaVα2δ1–HA WT or mutant. A, representative whole-cell Ca2+ current traces were recorded in the presence of 2 mm Ca2+ from a holding potential of −100 mV. From left to right: CaV1.2 WT with mCherry–CaVα2δ1–HA WT; CaV1.2 R1119A with mCherry–CaVα2δ1–HA WT; CaV1.2 WT with mCherry–CaVα2δ1–HA D171A, and CaV1.2 R1119A with mCherry–CaVα2δ1–HA D171A. Time scale is 100 ms throughout. The current density scale is either 5 or 10 pA/pF as indicated. B, averaged current-voltage relationships. Peak current densities versus voltage relationships were measured for the WT construct and the mutants (as shown). Current traces obtained with the empty mCherry vector (mock vector) are also shown. Statistical analyses were performed with a one-way ANOVA test: *, p < 0.01, and **, p < 0.001, against the mock vector. See Table 1 for details. C, distribution of the free energies of activation. The values of the free energy of activation (ΔGact) for all conditions were significantly different from the values measured with the mock vector.

